Time series data archive
List of data by deployment date
View summary data for the time period after the deployment date, during which data are subsequently gathered. See current live data.
- PAP June 2025
- PAP May 2024
- PAP May 2023
- PAP May 2022
- PAP Apr 2021
- PAP Nov 2020
- PAP Jul 2019
- PAP Jun 2018
- PAP Apr 2017
- PAP Apr 2016
- PAP Jul 2015
- PAP Jul 2014
- PAP Apr 2013
- PAP May 2012
- PAP Jul 2011
- PAP Sep 2010
- PAP May 2010
- PAP May 2009
- PAP Jun 2007
- PAP Jul 2006
- PAP Jun 2004
- PAP Nov 2003
- PAP Jul 2003
- PAP Oct 2002
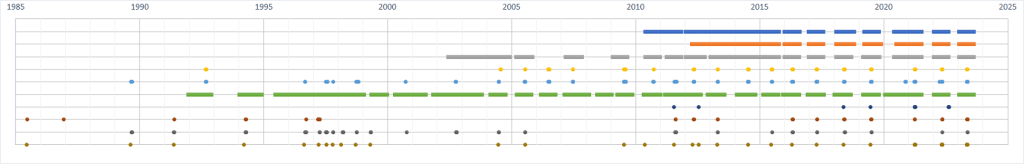
Data availability
Use the chart to check if data has been generated (points indicate discreet sampling events or surveys, continuous lines represent long-term measurement or sampling). Mooring or individual sensor failure may leave a gap in the data sets. The order in which data types are listed reflects their vertical position in the water column. Further information about the datasets and equipment used are provided below.
Click on a data type below to find out more; scroll the chart to see earlier/later data.
Data types
![]()
Meteorological data
The UK Met Office use data from the PAP-SO surface buoy in their routine operations. Near real-time data is available. The surface buoy also provides a platform for atmospheric CO2 measurements and data telemetry.
![]()
Surface Sensors
Sensors fitted to the keel of the Met Office buoy at 1m depth measure biogeochemistry variables such as CO2, pH, oxygen and nutrients. Coupling the seawater and atmospheric CO2 provide an important contribution to the Integrated Carbon Observing System (ICOS) for the calculation of greenhouse gas fluxes. Sensor data are available through the British Oceanographic Data Centre (BODC).
![]()
Biogeochemistry sensors at 30m depth
Sensors at 30m depth are located in the deep chlorophyll maxima and within the mixed layer for most of the year. They include sensors that measure essential ocean variables such as temperature, salinity, nutrients, oxygen, CO2 and chlorophyll-fluorescence. The data are used to follow progress of phytoplankton blooms and flux throughout the year in the productive northeast Atlantic. Sensor data are available through BODC.
![]()
Zooplankton nets
The annual wp2 net samples are vertical hauls from 200m, at noon and midnight on up to three separate days. These samples are preserved in formalin and are run through a flowcam macro at NOC to create an image library for each cruise.
![]()
CTD profiles
The annual CTDs include high frequency profiles to full depth, as well as bottle samples. The samples are analysed for salinity and biogeochemistry (including carbonate, nutrient and dissolved oxygen data). The data are used both for process studies (when additional samples can be collected), and to validate sensors that we have on the various moorings and on the ship. The profile an sample data are available through BODC.
![]()
Sediment traps
Sediment traps are deployed at 3,000m depth and 100m above bottom (4,750m) for approximately a year. Samples are preserved in formalin and analysed back at NOC. Both data (BODC) and some fractions of remaining samples are available.
Find out more about sediment traps
![]()
Seabed photography
Seafloor photography and time-lapse photography are not currently available via this site.
![]()
Amphipod traps
Baited traps collect specimens of the scavenging fauna that live near the seabed at PAP-SO. Long-term observations have been used to demonstrate change in the community structure over time. The data are available through the Ocean Biodiversity Information System (OBIS) and specimens are housed in the Discovery Collections at the National Oceanography Centre.
![]()
Scientific trawling
Trawl sampling at the PAP-SO date back to 1985 and represent one of the longest abyssal time series sampling programmes. The specimens are housed in the Discovery Collections at the National Oceanography Centre.
![]()
Seabed cores
The core samples collected at PAP-SO serve many purposes, often providing supporting environmental data for other studies. The macrofauna specimens from core sampling are housed in the Discovery Collections at the National Oceanography Centre.