The PAP1 mooring was redeployed deployed on 6 May on cruise JC071.
The activities can be found in the cruise blog.
The data received by satellite were processed within hours of recording and plotted in the following graphs.
After recovery, data were archived at the British Oceanographic Data Centre (BODC) and can be accessed at: BODC PAP Collection. Please use the search term Porcupine or #5192 to find our data.
January 2013
Early in the morning of 29 December 2012 the PAP surface buoy became detached and started moving off station. Most fortuitously the RV Celtic Explorer is on a scientific cruise in the area, and had been due to carry out some essential maintenance on the meteorological sensors. The buoy has been located and recovered despite the wintry weather conditions.
July 2012
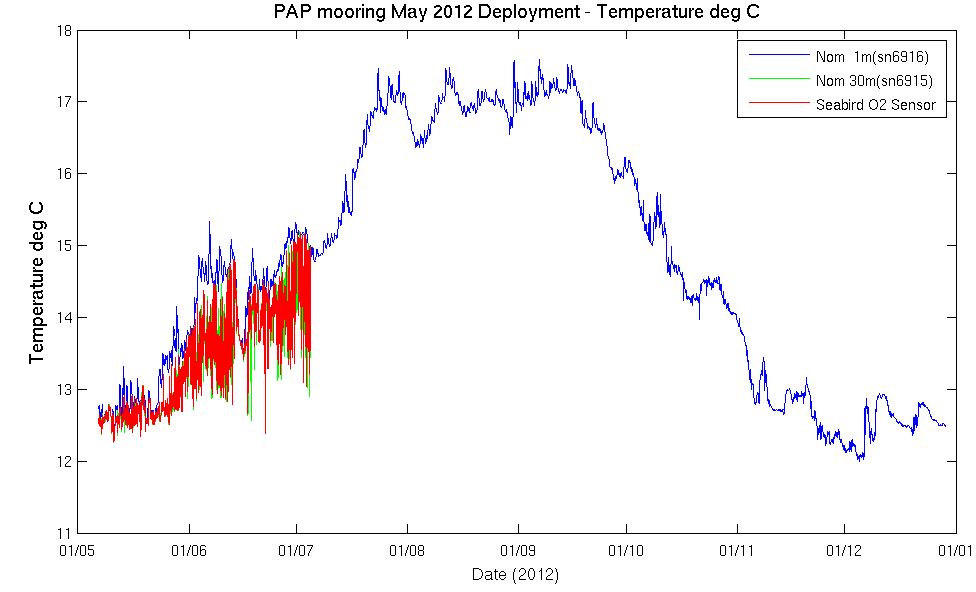
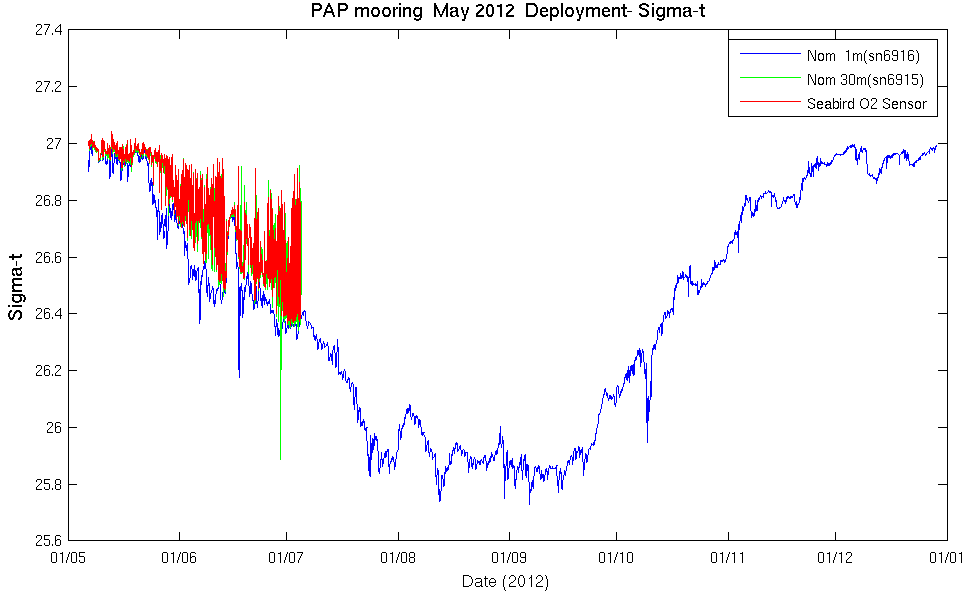
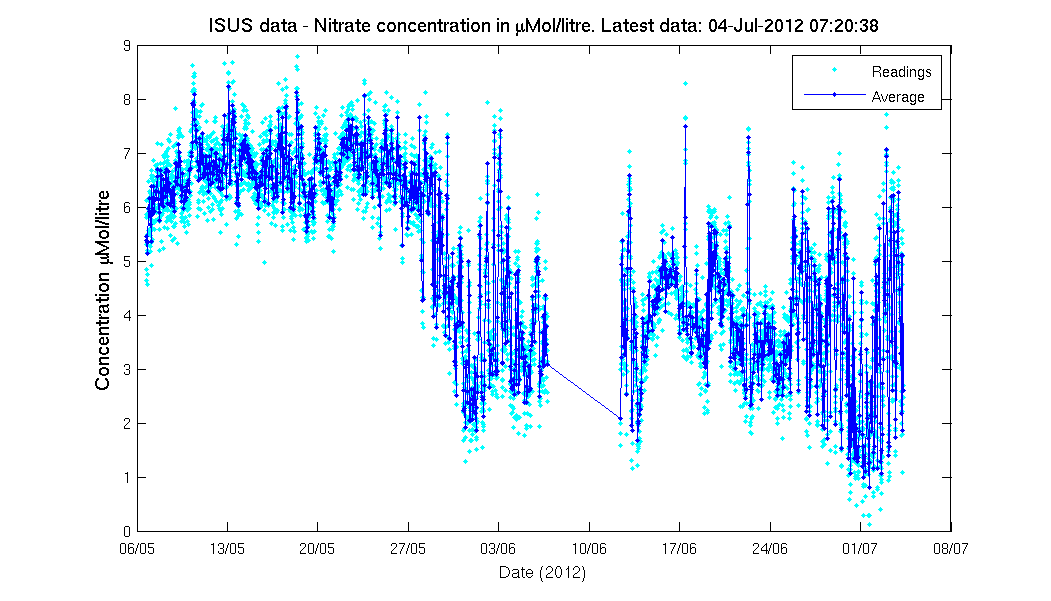
It appears that, after a period of working intermittently, the communication cables connecting to the sensor frame failed completely on 4 July. Meteorological data is still being sent and received, as well as some engineering data and readings from a single Microcat attached to the keel of the buoy. Many of the sensors at 30m will continue to log data, but that will not be recovered until the next service visit.
Click here to view engineering graphs
Temperature
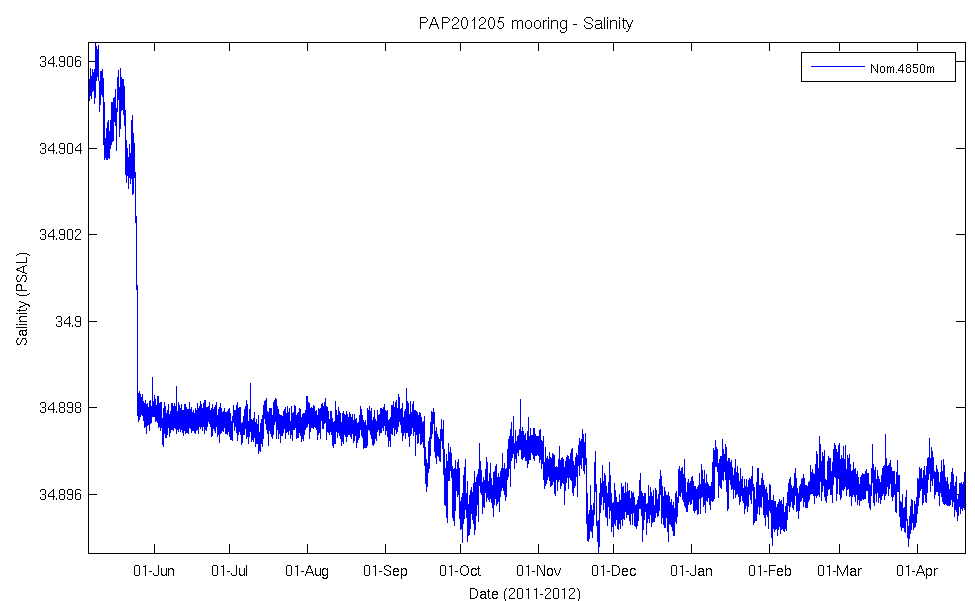
Salinity

Sigma-t
Microcats with Oxygen
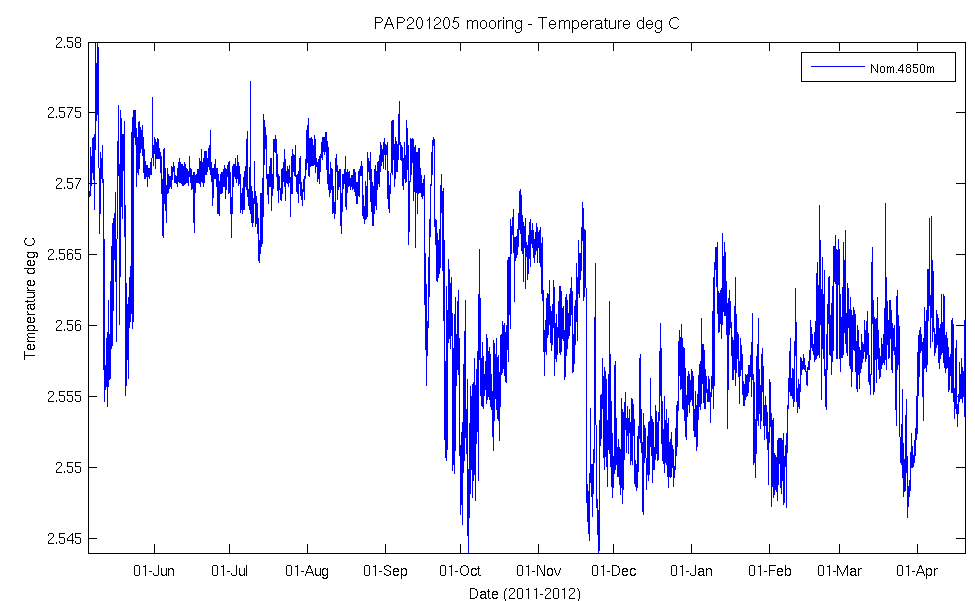
Deep Temperature
Deep Salinity
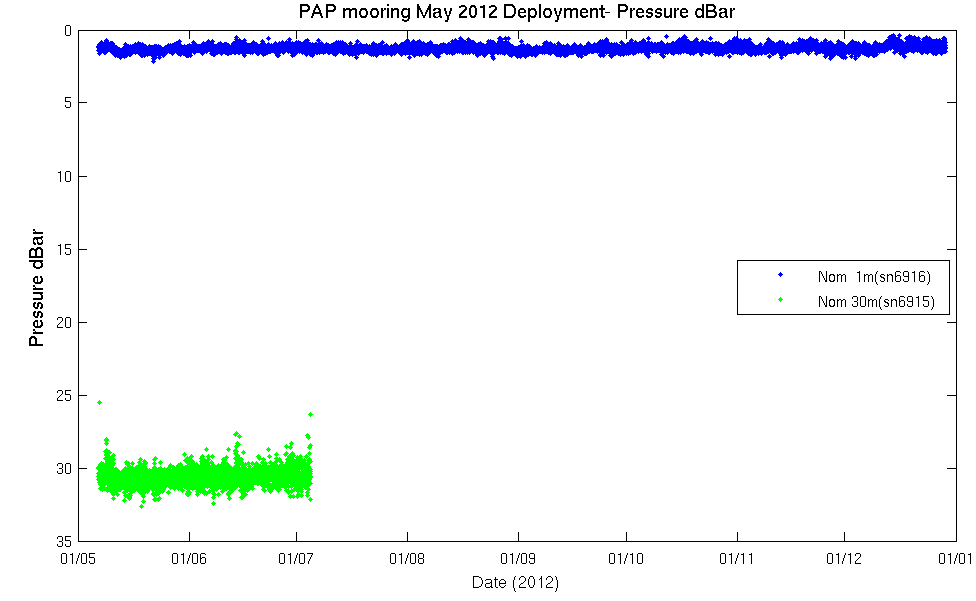
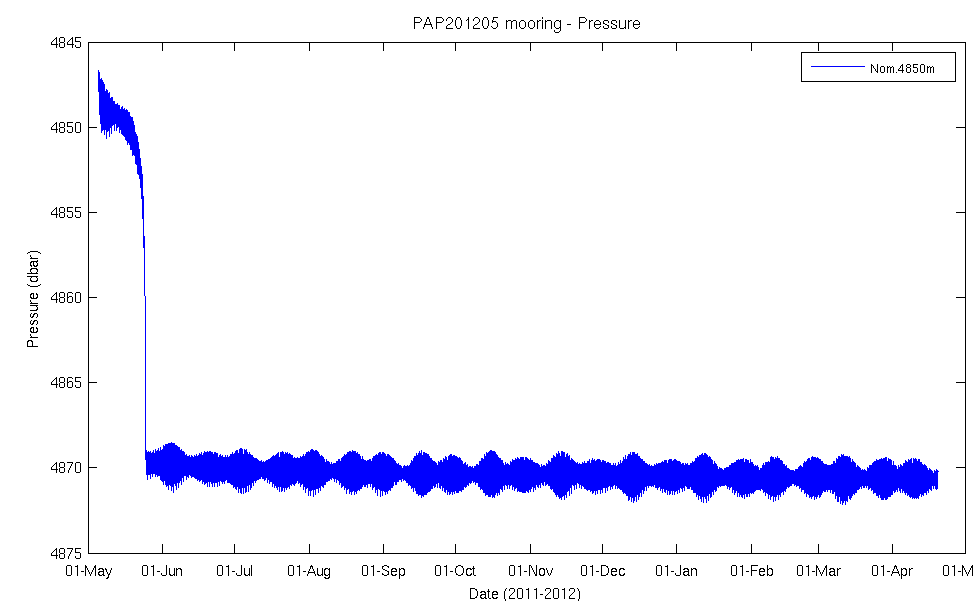
Deep Pressure
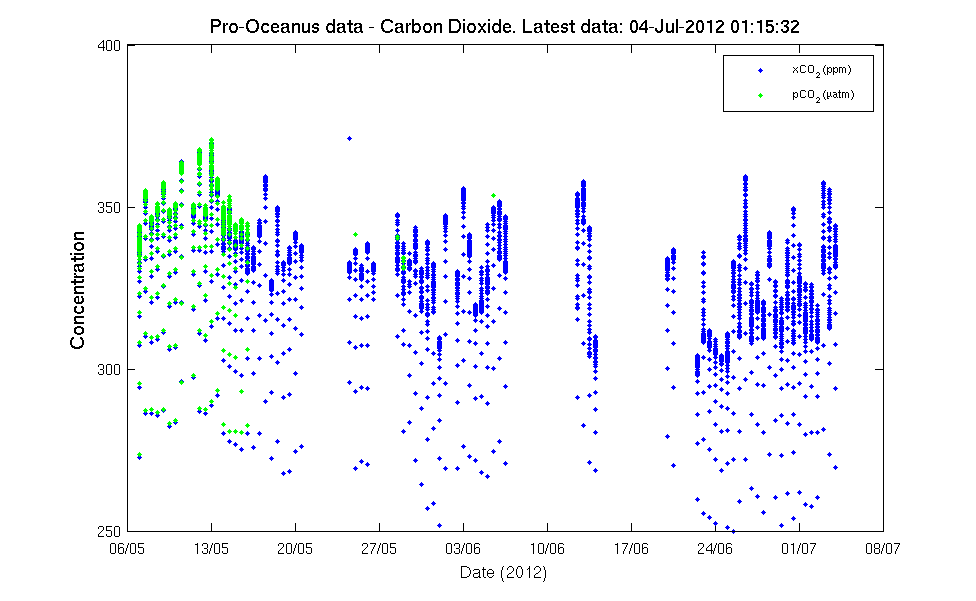
Carbon Dioxide
Pro-oceanus Pressures

Aanderaa Carbon Dioxide

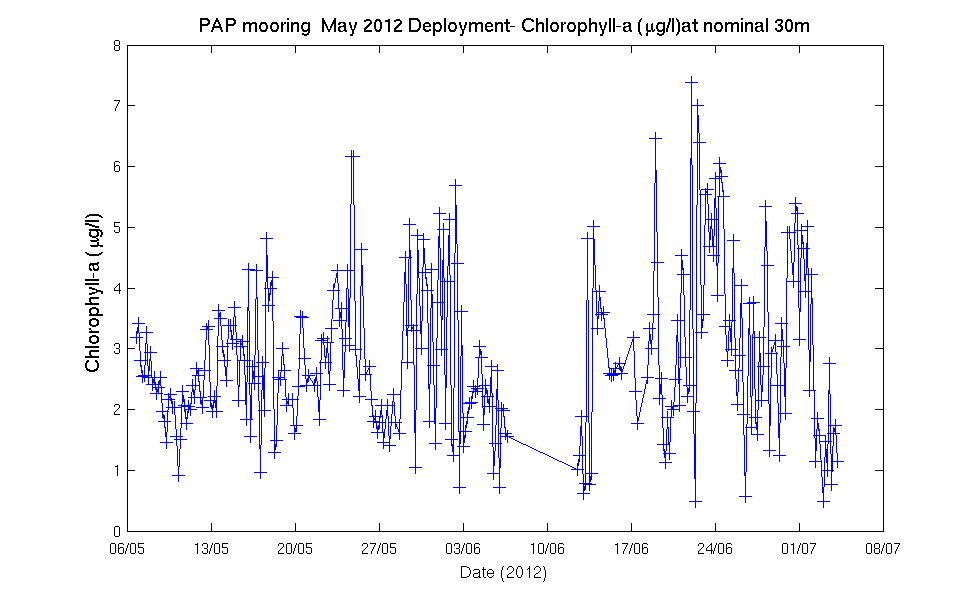
Chlorophyll-a Wetlabs
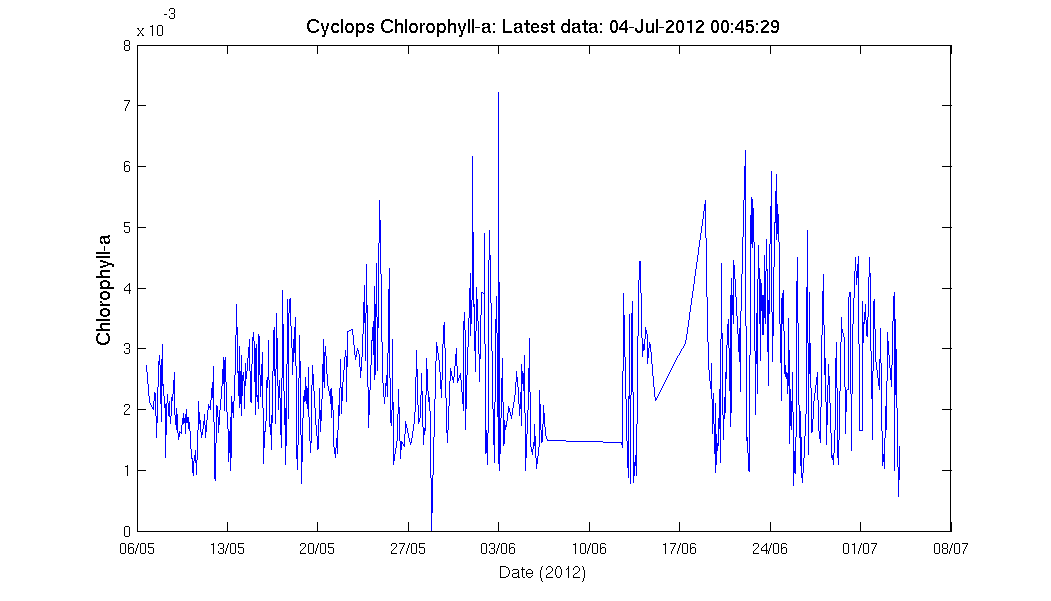
Fluorescence Cyclops
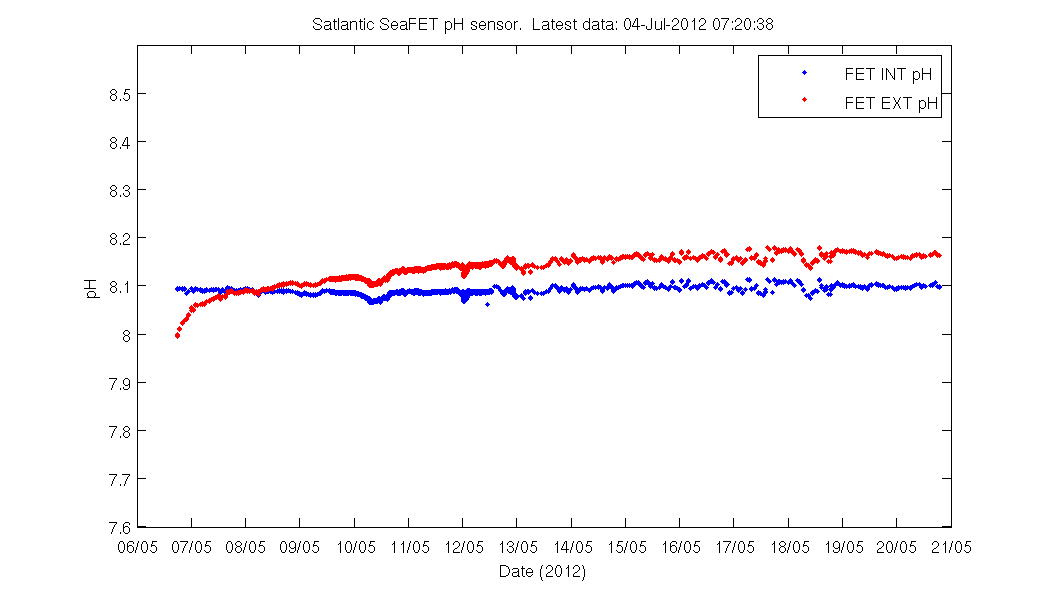
Satlantic pH
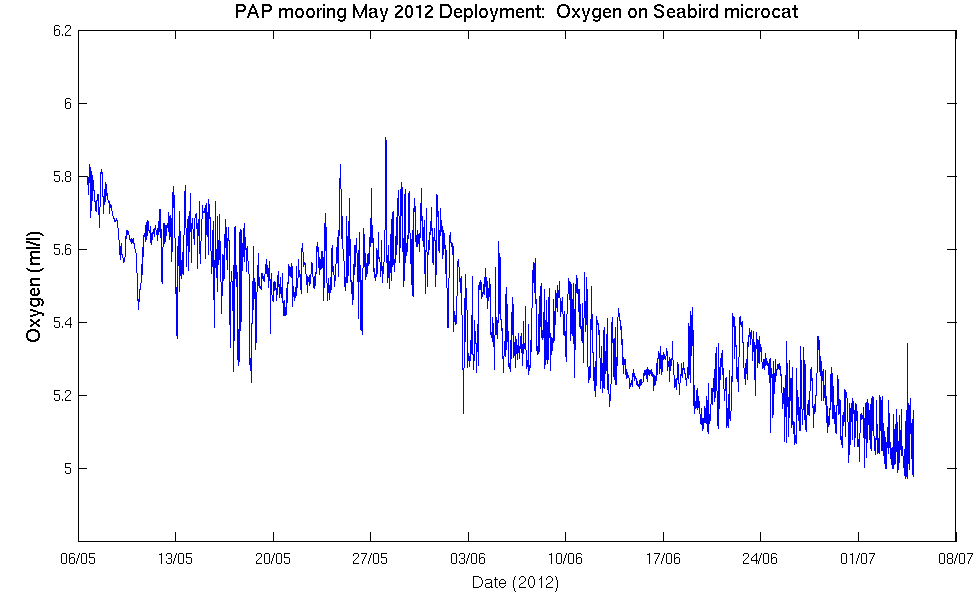
Seabird Oxygen
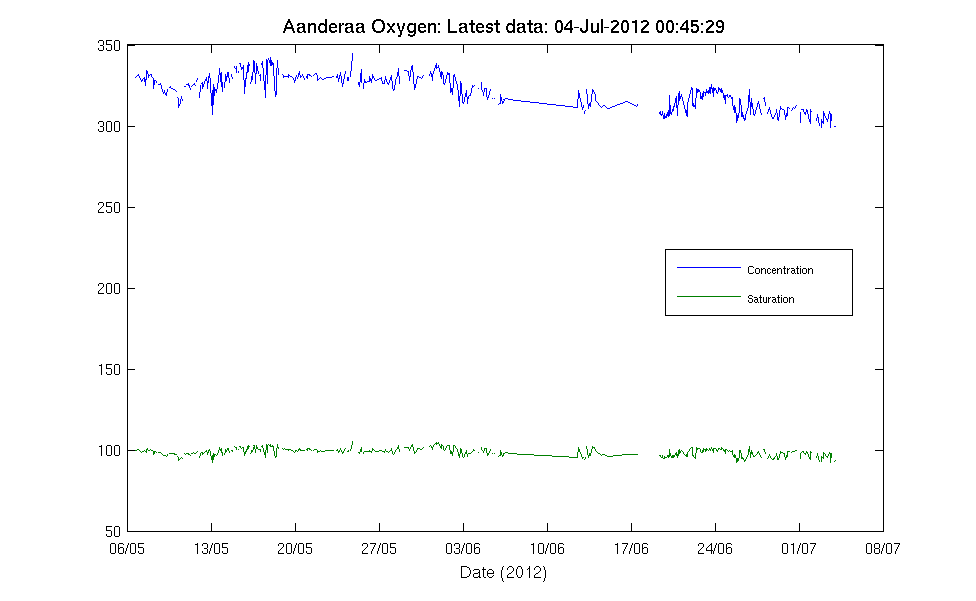
Aanderaa Oxygen
ISUS Nitrate
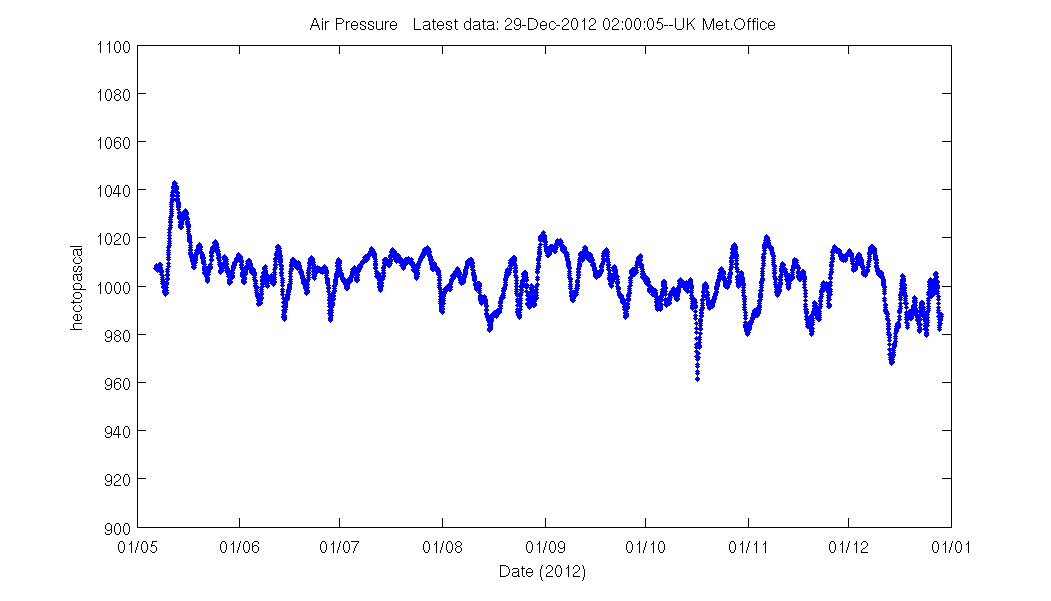
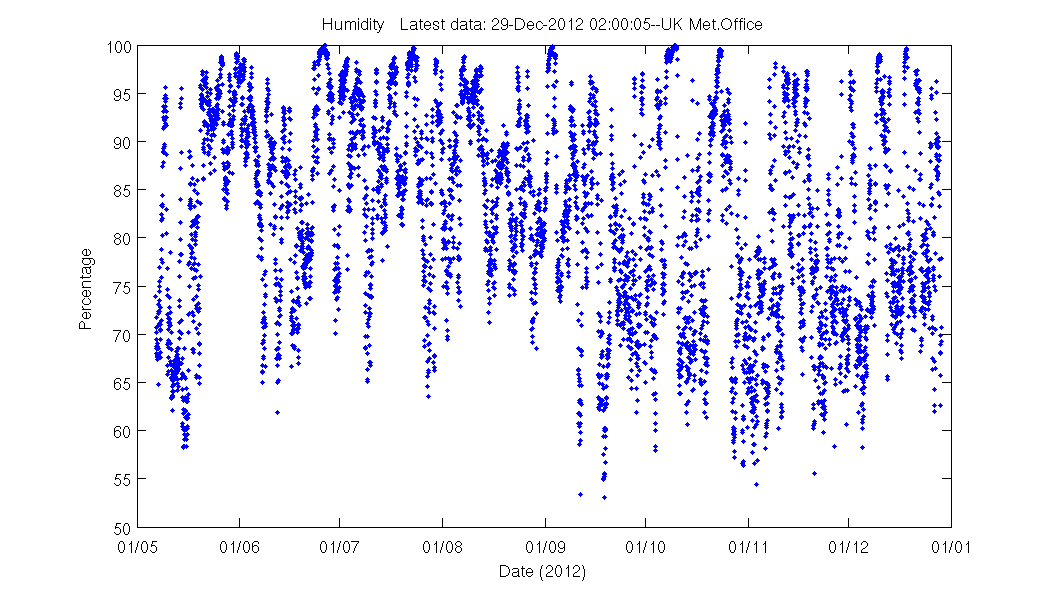
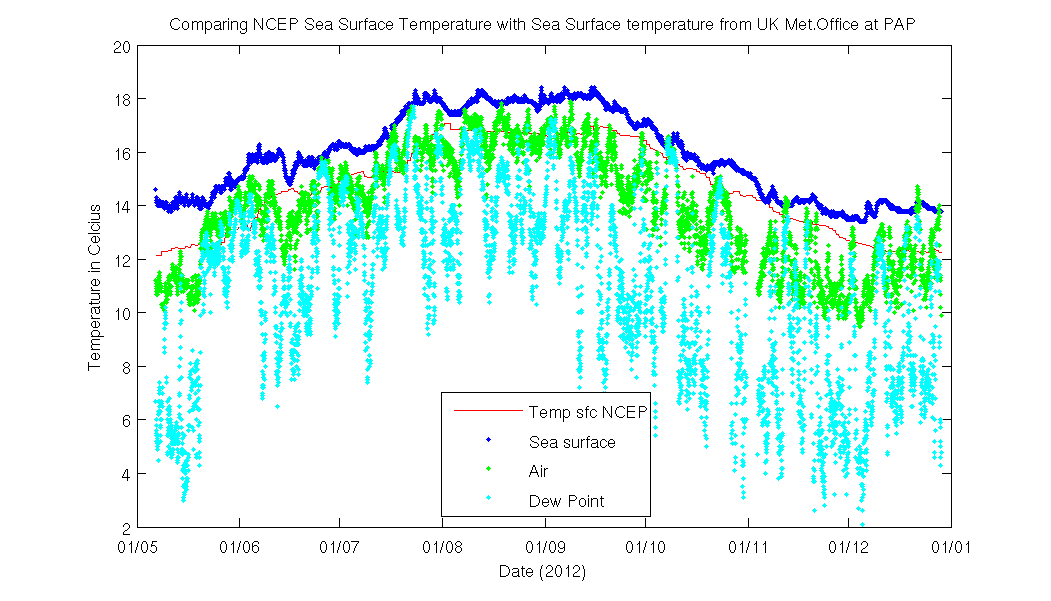
MetOffice UK Meteorological Data
Air Pressure
Humidity
Temperatures
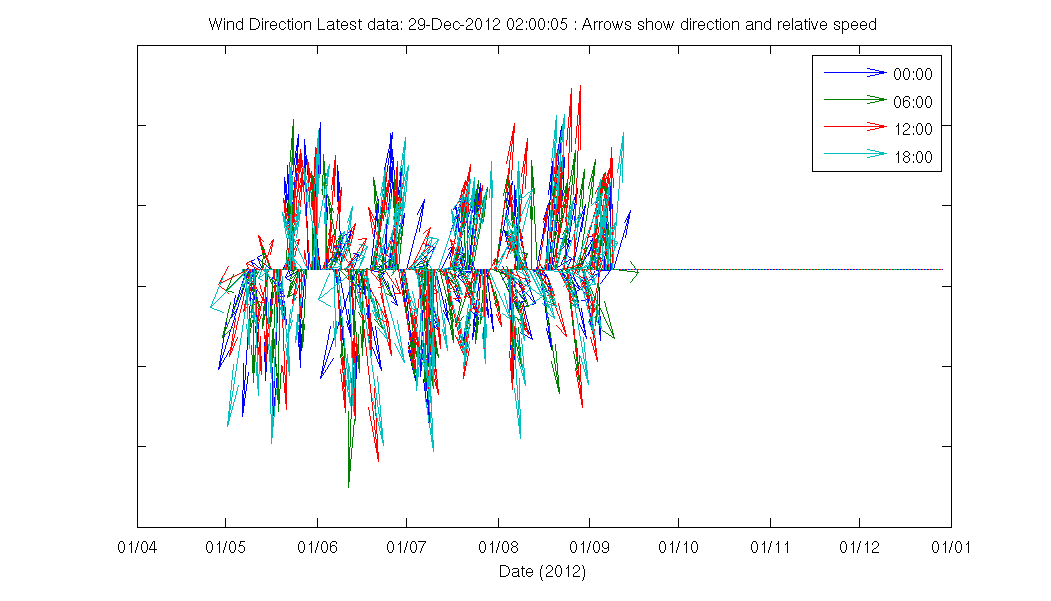
Wind Speed/Direction

Wind Vectors
NCEP Wind
![]()
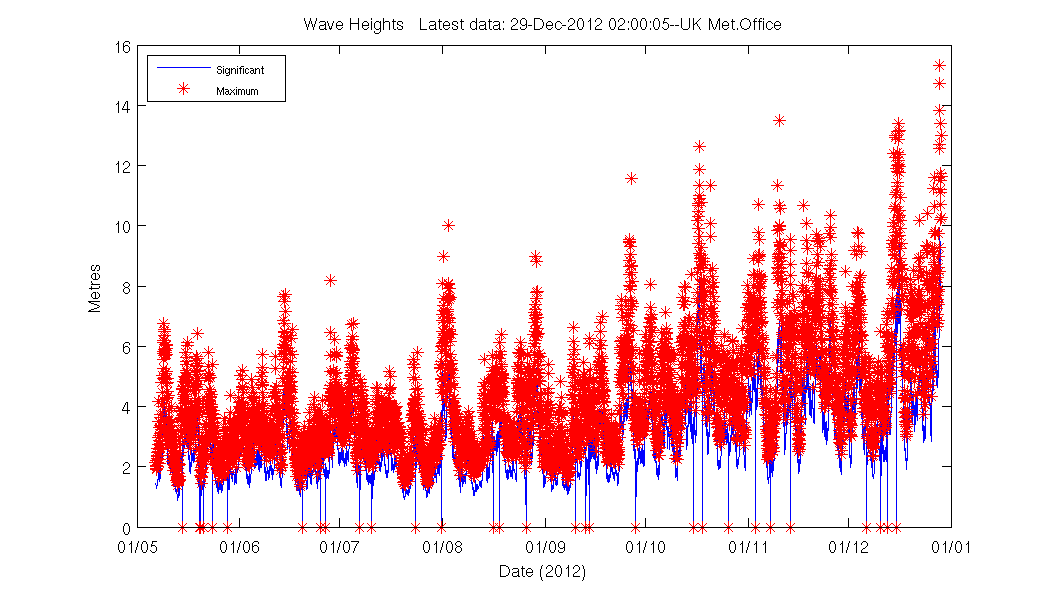
Wave Height
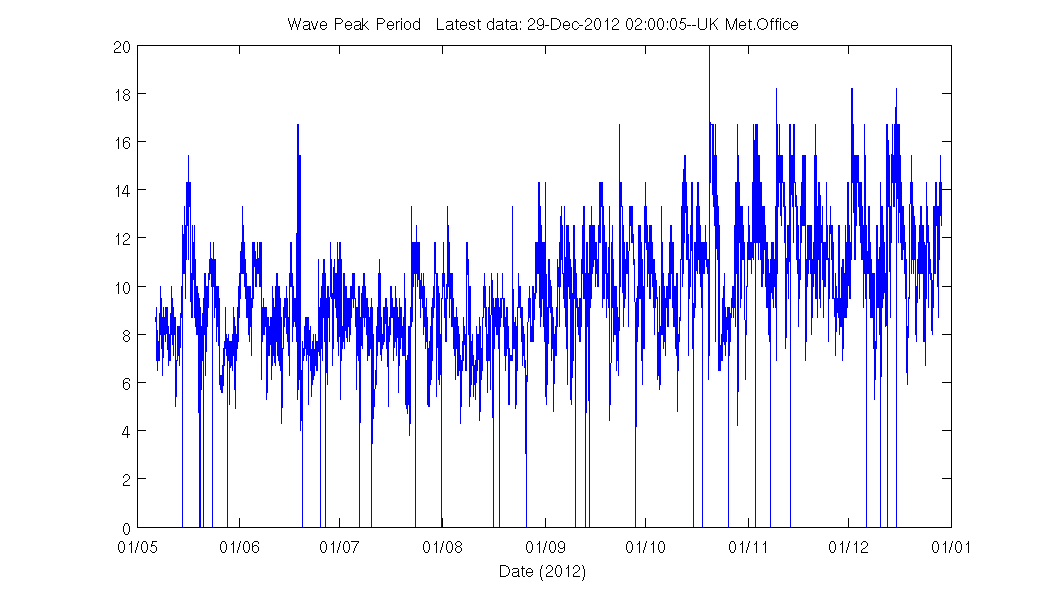
Wave Peak Period
Wave Vectors
![]()
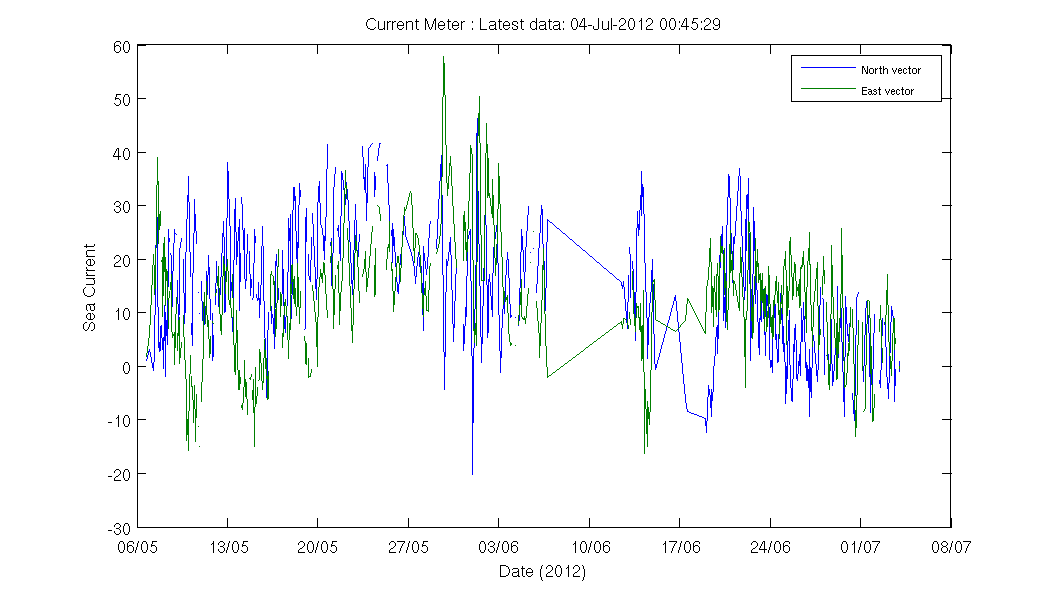
Sea Current Vectors
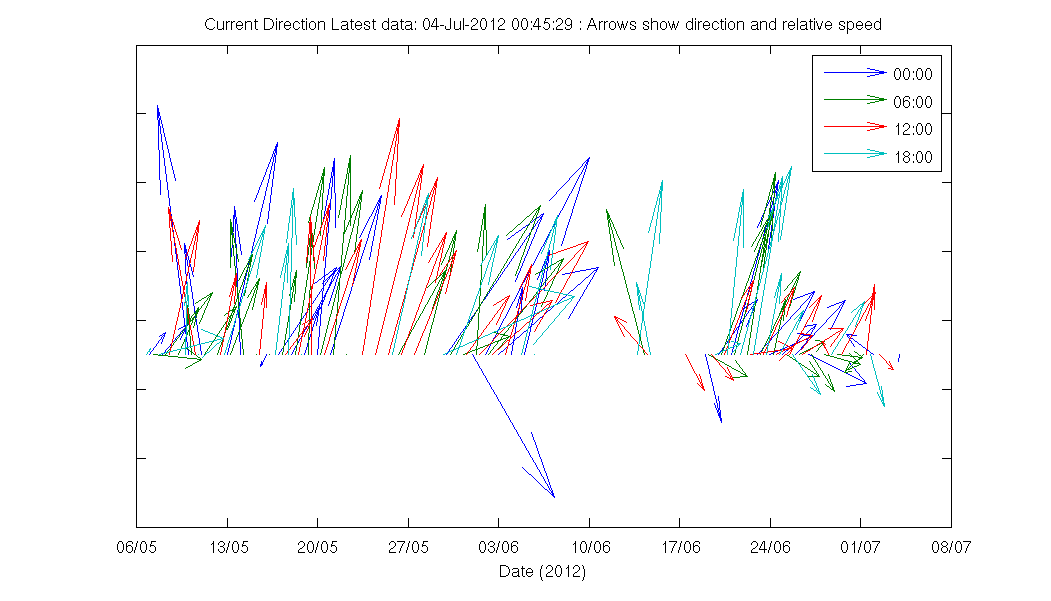
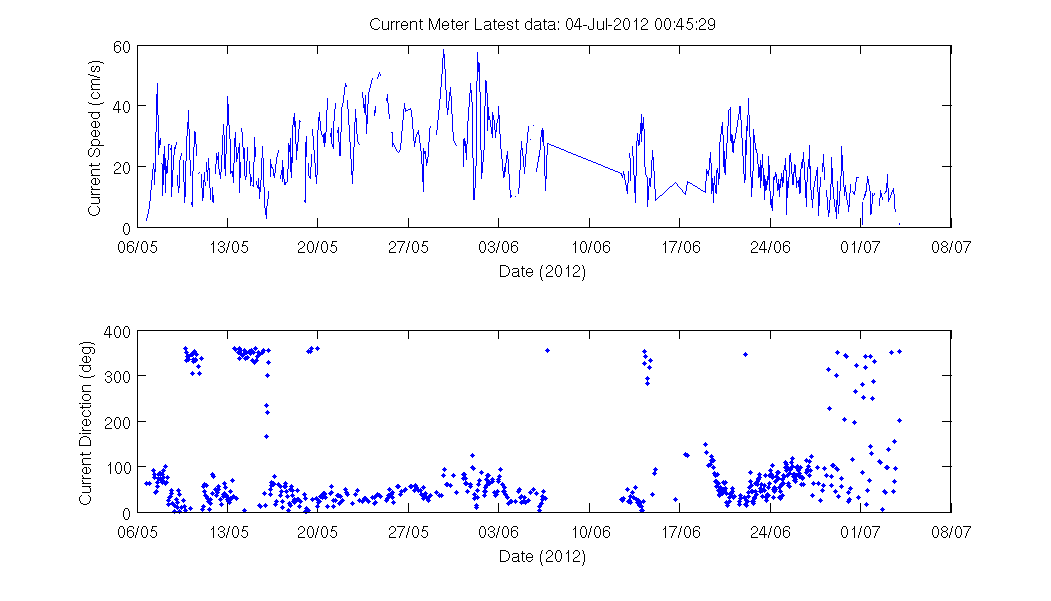
Sea Current Speed/Direction
Sea Current
Irradiance 1

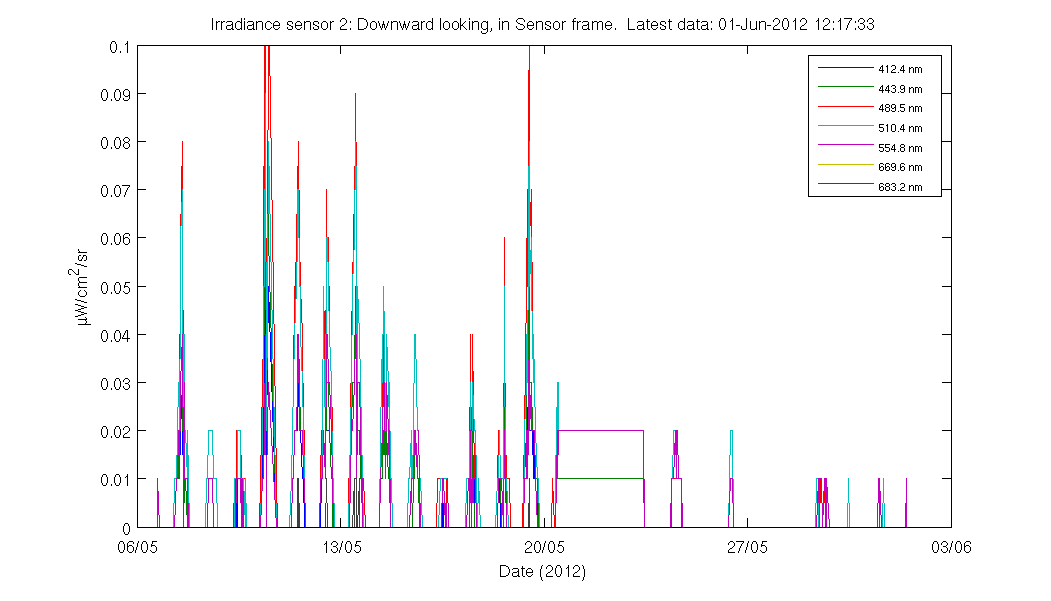
Irradiance 2
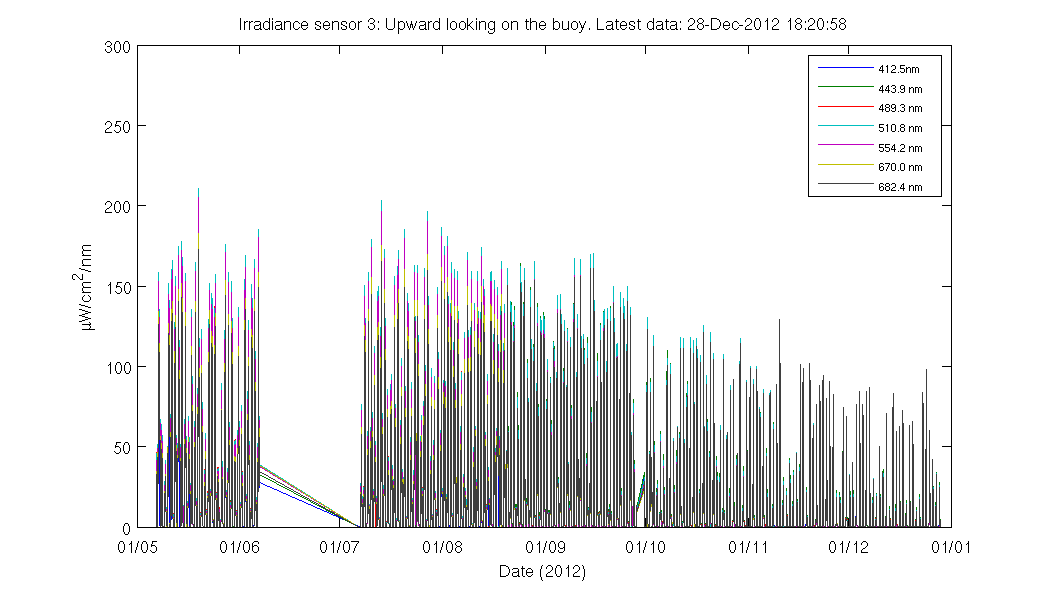
Irradiance 3
Mooring Position

Last 7 days Track

Pressure