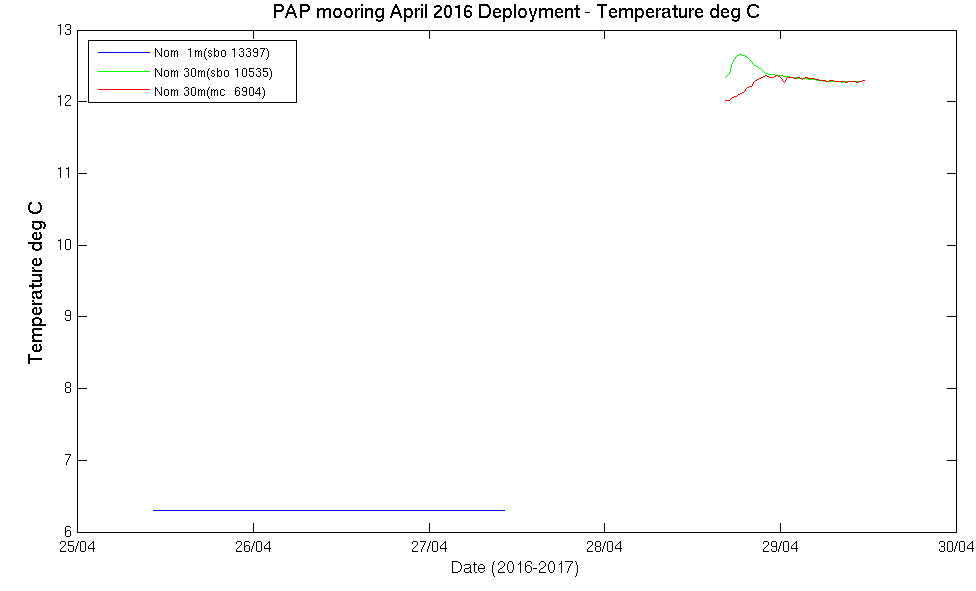
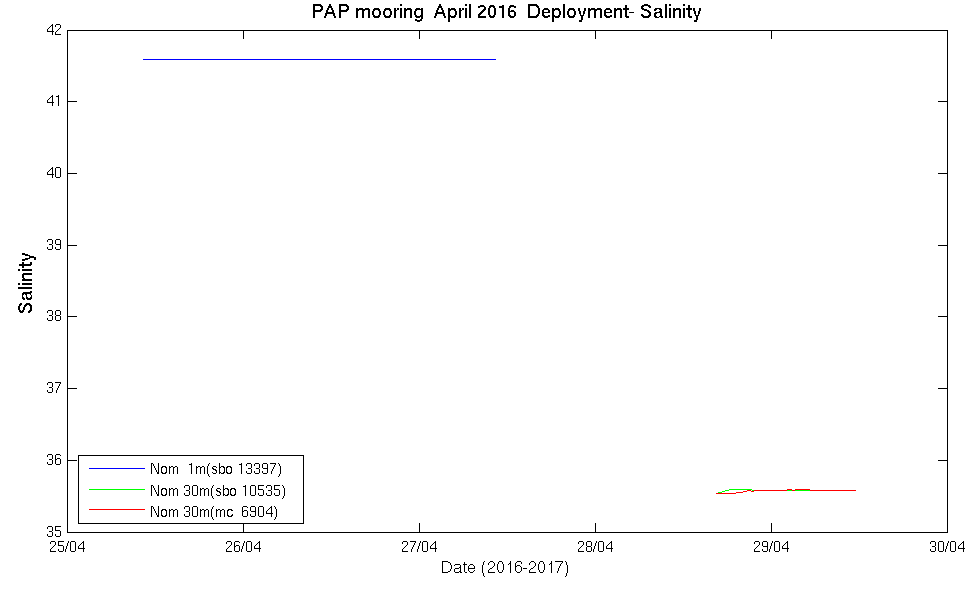
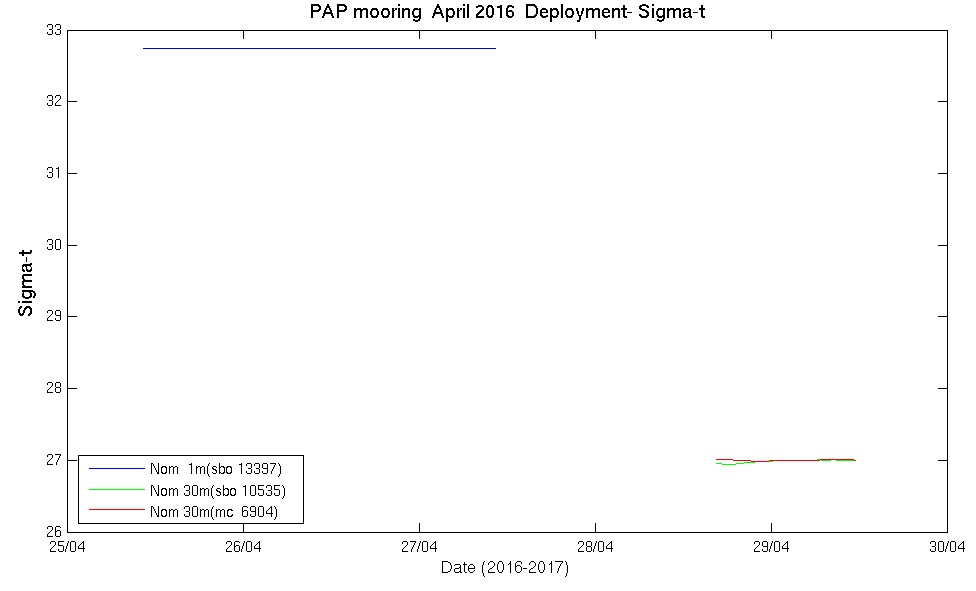
The April 2016 mooring was deployed on RRS Discovery cruise DY050
Below are the graphs generated in near-real time from data gathered at PAP and transmitted via iridium servers.
Unfortunately, the transmission failed shortly after deployment, and near real time data feeds were lost.
The sensors continued to operate and record data locally, and were recovered in April 2017 when the mooring was serviced.
After recovery, data were archived at the British Oceanographic Data Centre (BODC) and can be accessed at: BODC PAP Collection. Please use the search term Porcupine or #5192 to find our data.
A diverse range of Essential Climate variables are measured and sampled at the PAP site from the atmosphere and surface ocean to the seafloor. Seafloor sampling includes trawling, coring, towed camera systems from a research ship and time-lapse photography. Since 2002 many of the upper ocean measurements (0-1000m) have been transmitted in near real-time.
Below are the graphs generated in near-real time from data gathered at PAP. Click on an image to see a larger version.
Click here to view engineering graphs
Oceanographic instruments on keel and at 30m on frame, operating in near real time
Temperature
Salinity
Sigma-t
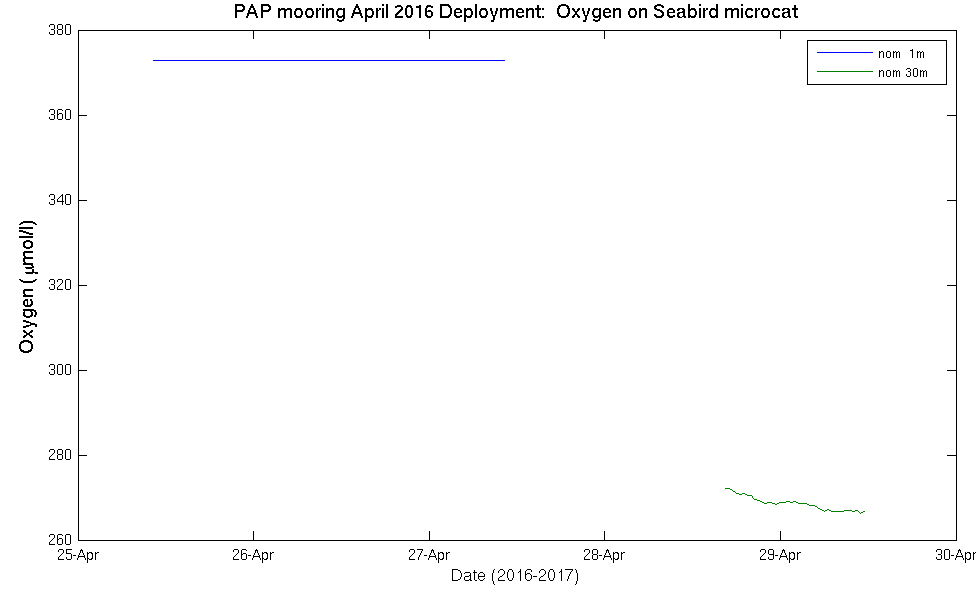
Seabird Oxygen
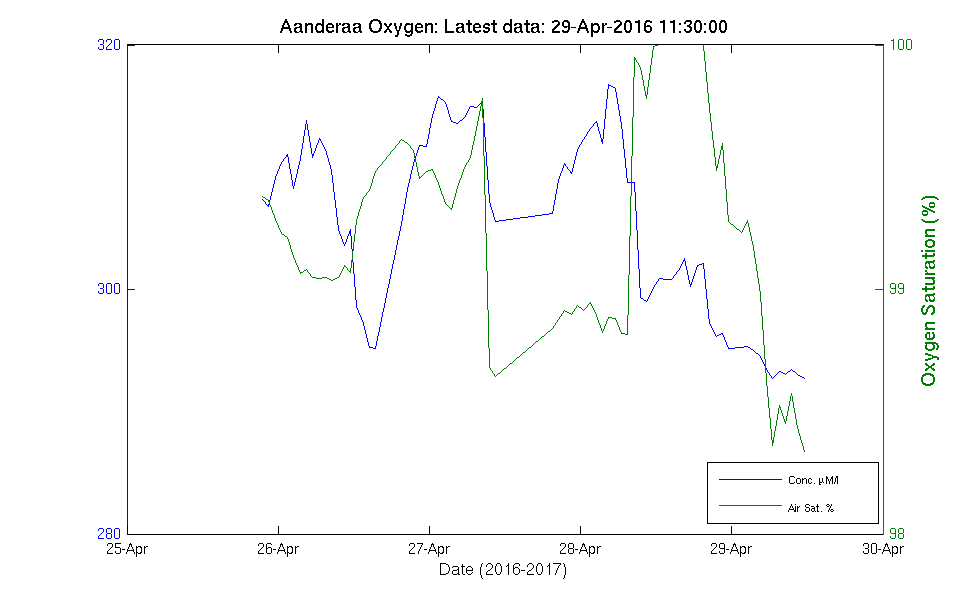
Aanderaa Oxygen
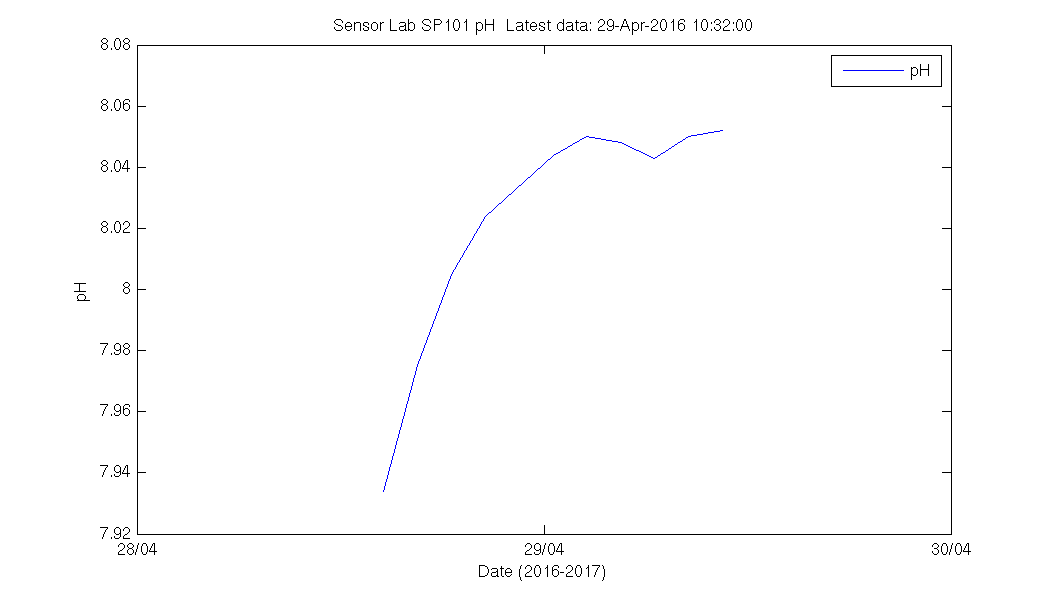
SP101-Nm pH at 1m
Carbon Dioxide at 1m
Carbon Dioxide at 30m
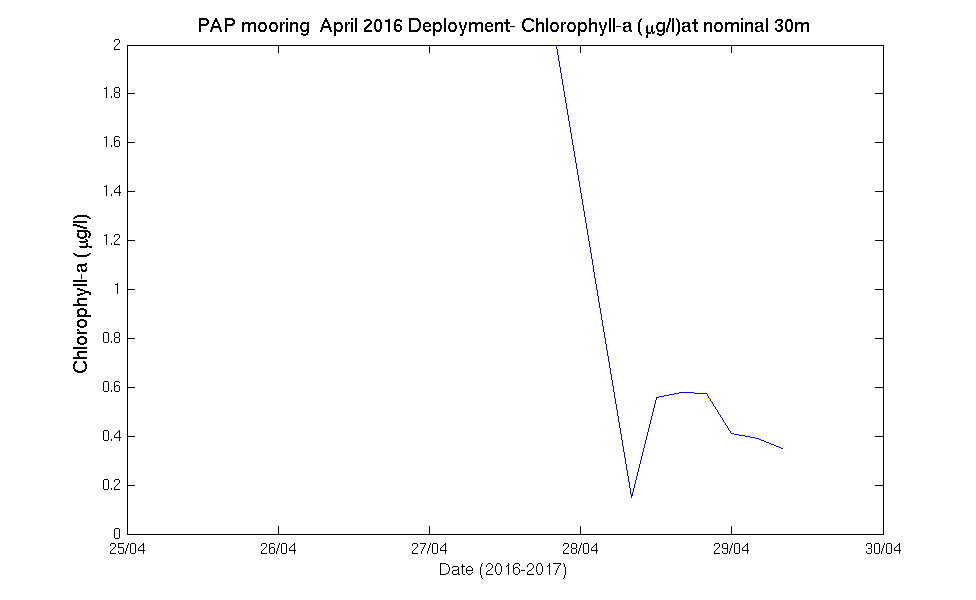
Chlorophyll-a Wetlabs
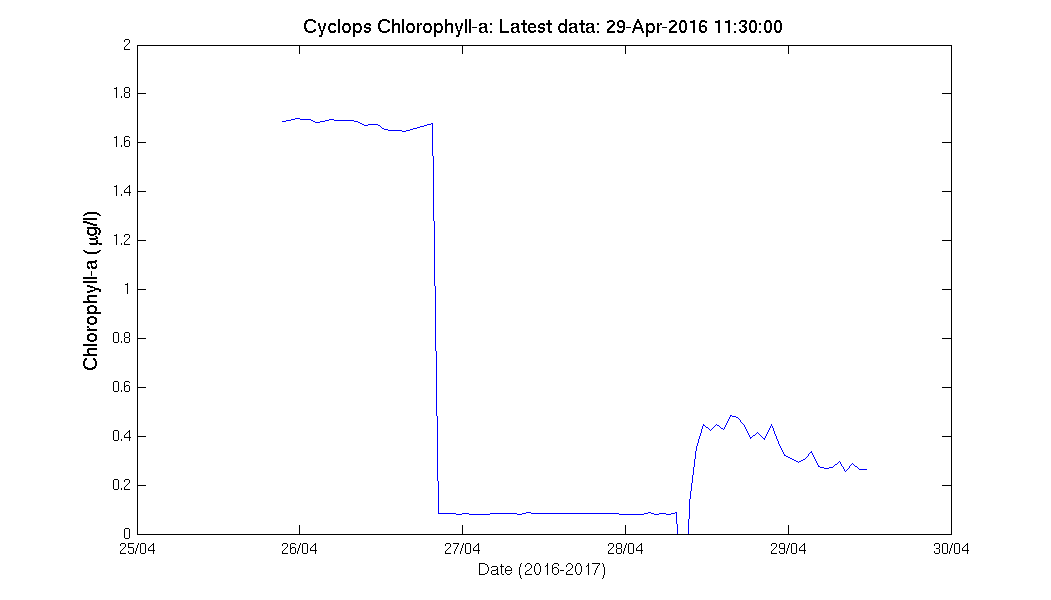
Fluorescence Cyclops
SUNA Nitrate at 30m

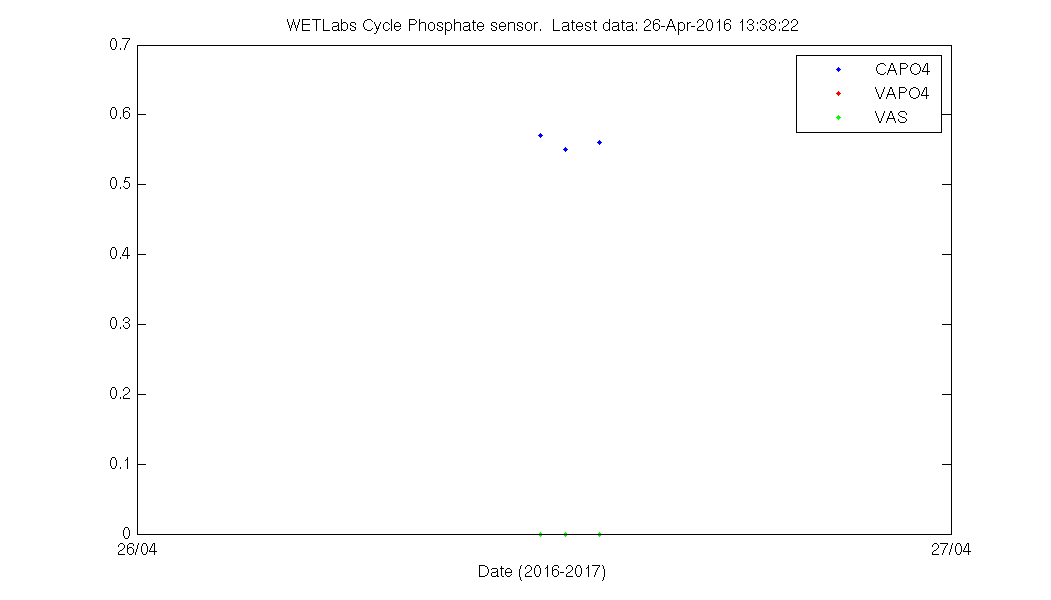
PO4 Wetlabs
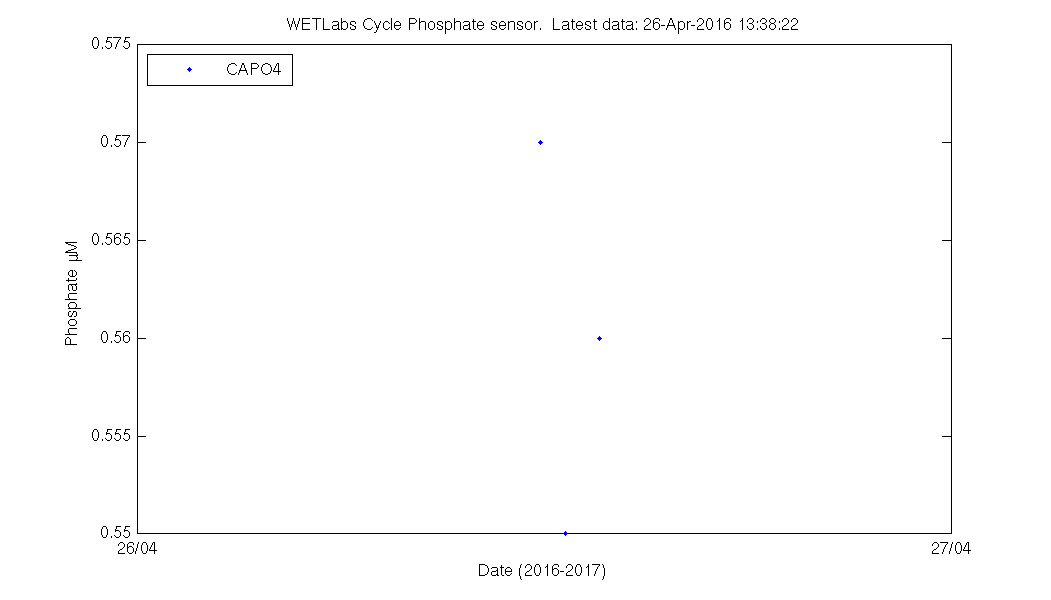
PO4 Wetlabs
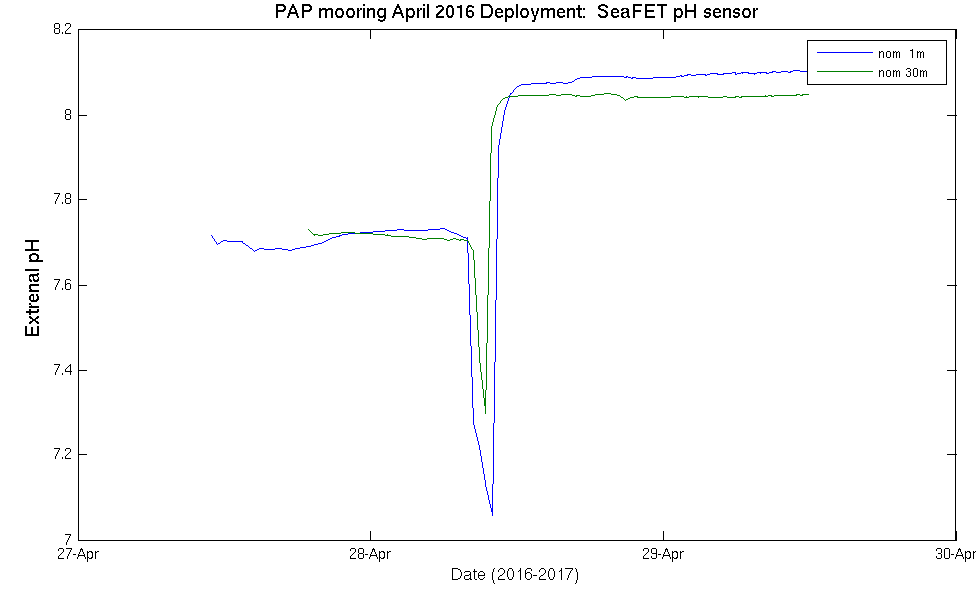
Satlantic SeaFET pH
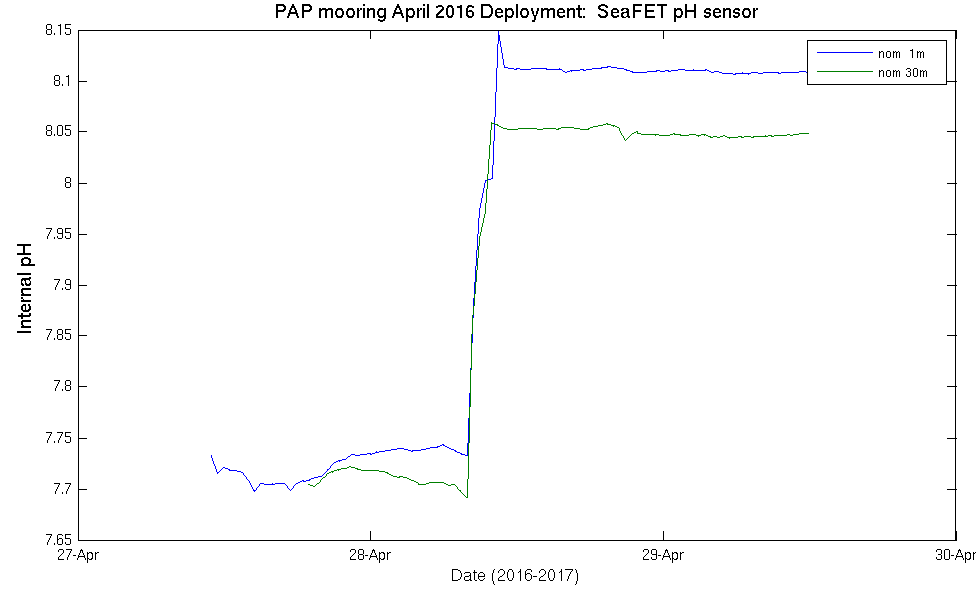
Internal pH
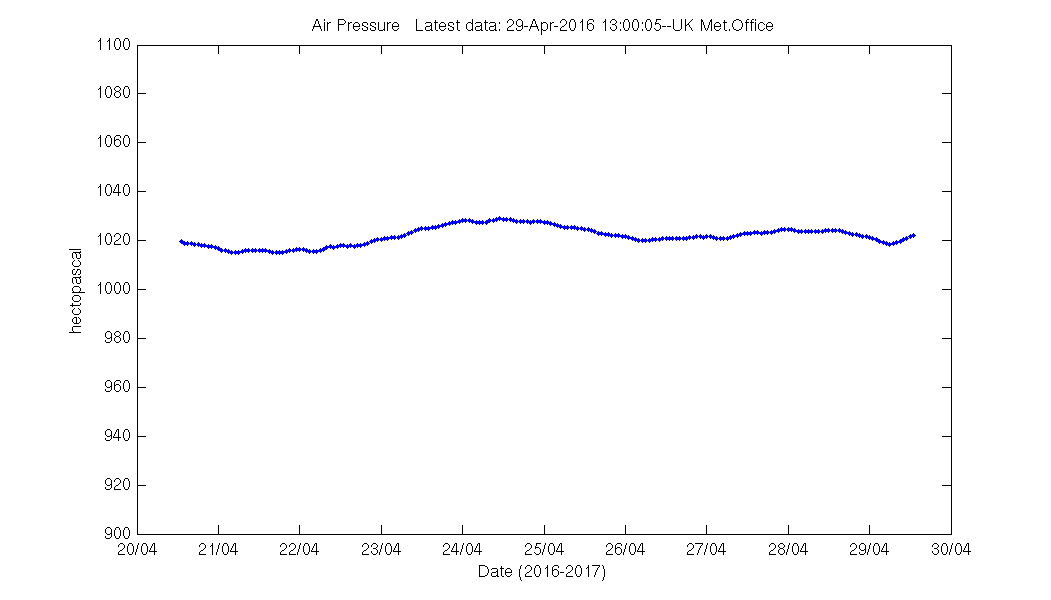
MetOffice UK Meteorological Data
PAP is part of the MetOffice network of weather buoys, click here to view the full network.
Air Pressure
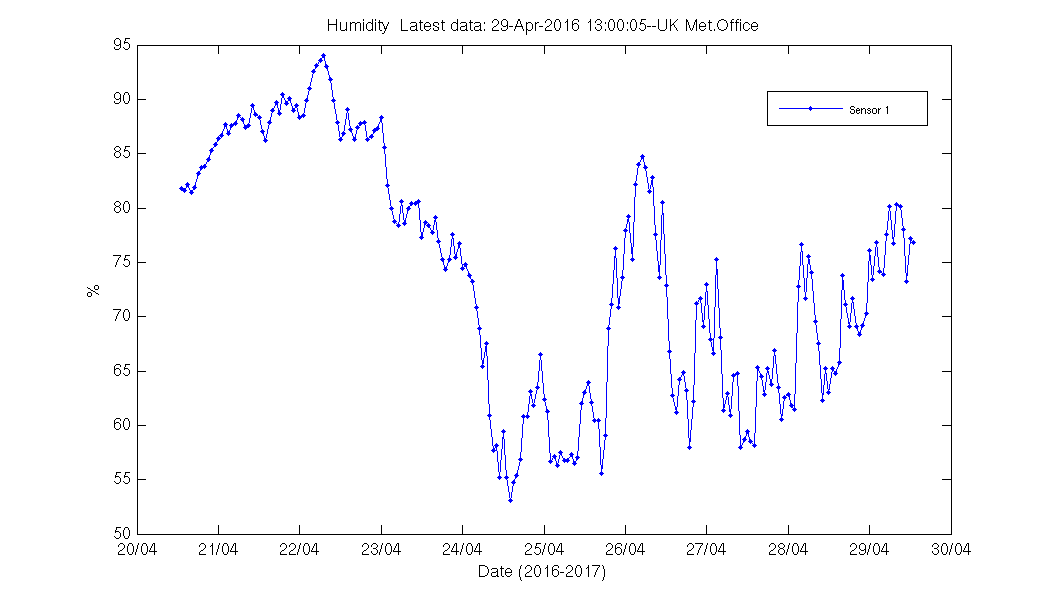
Humidity
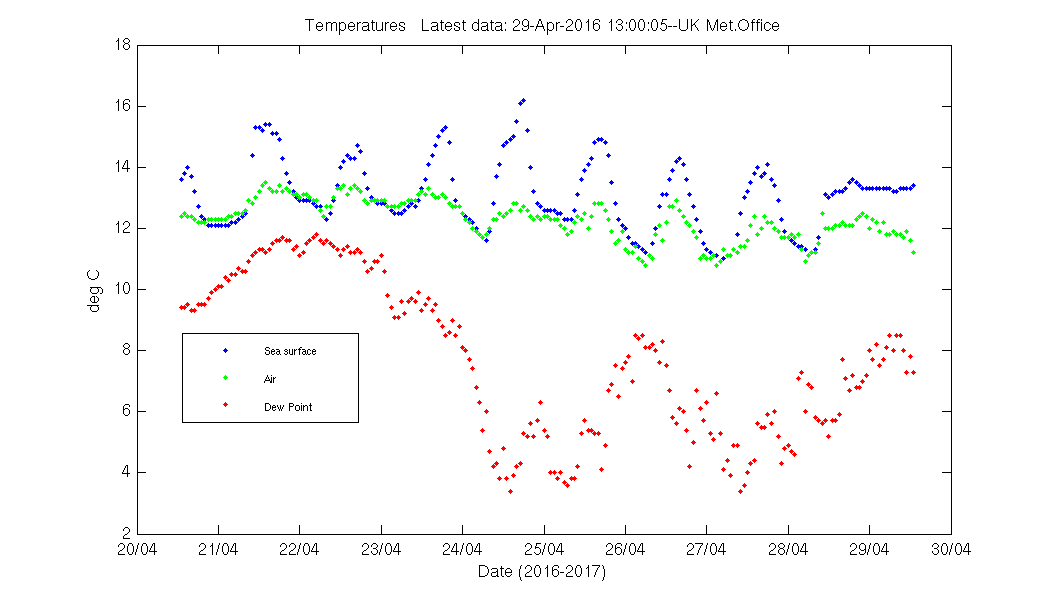
Temperatures
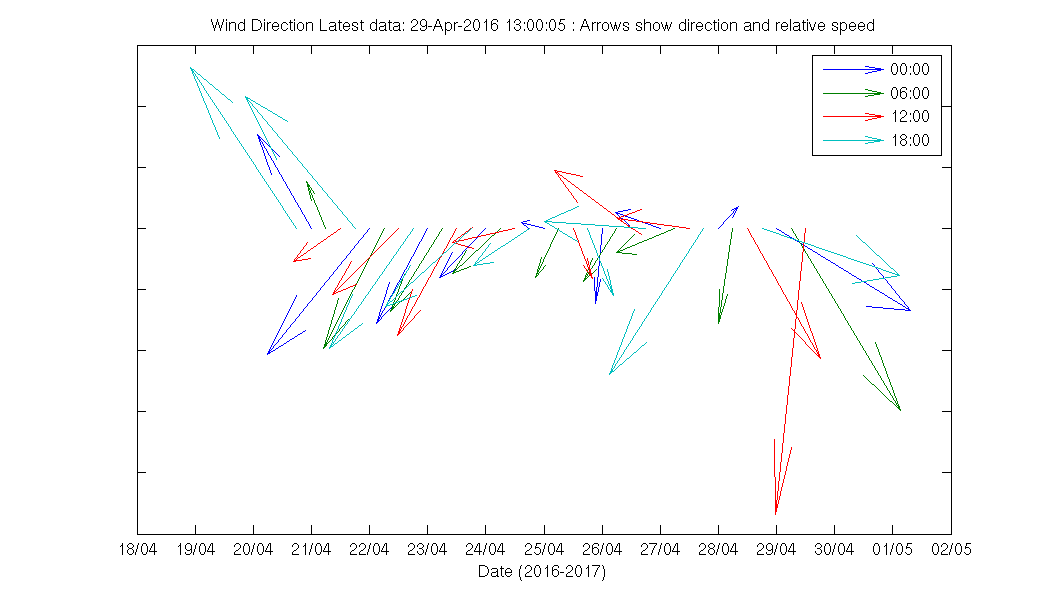
Wind Speed/Direction

Wind Vectors
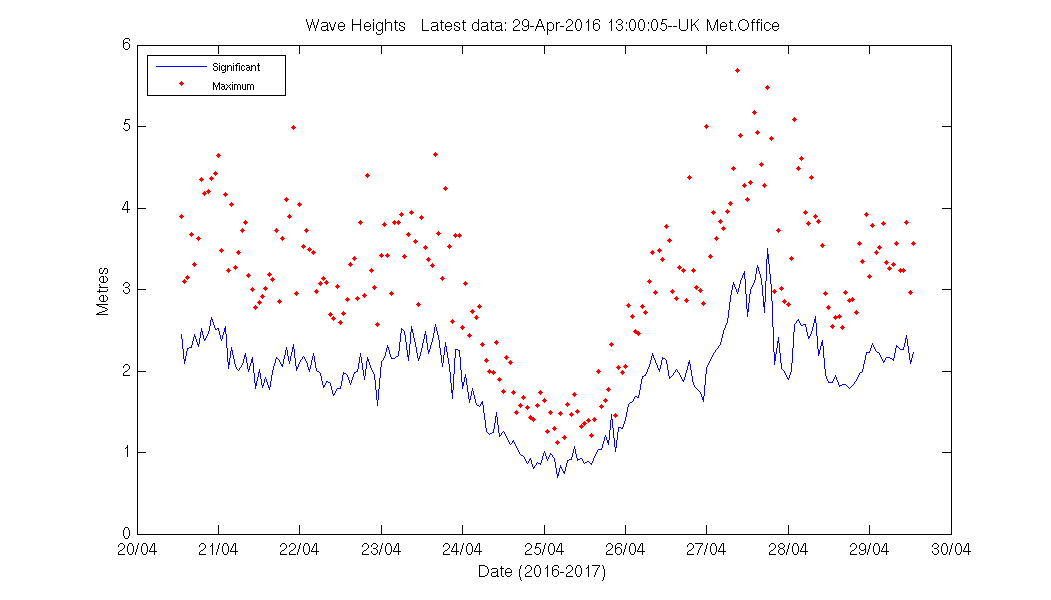
Wave Height
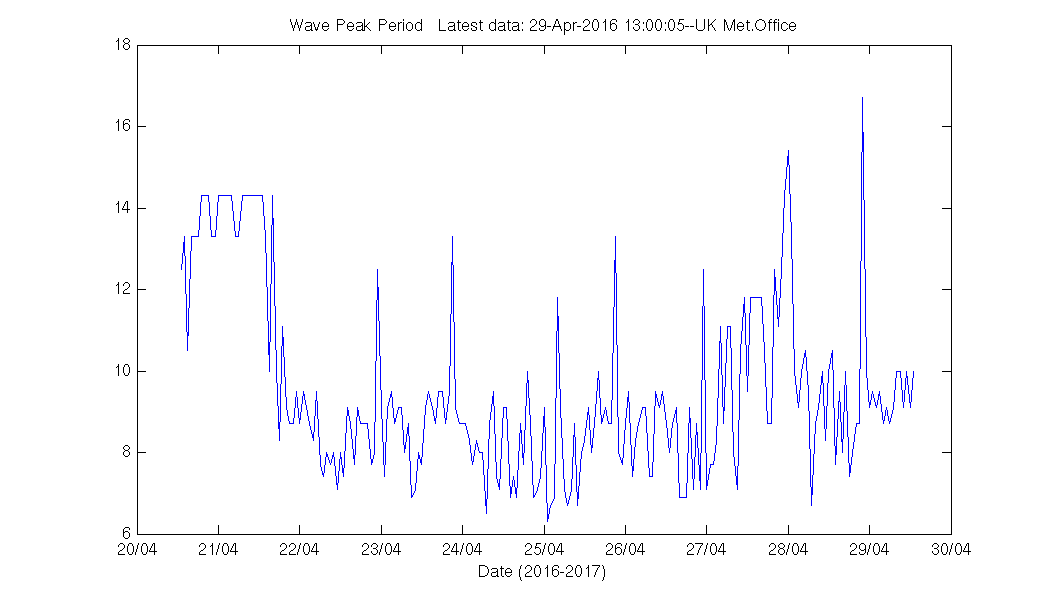
Wave Peak Period
Wave Vectors
![]()
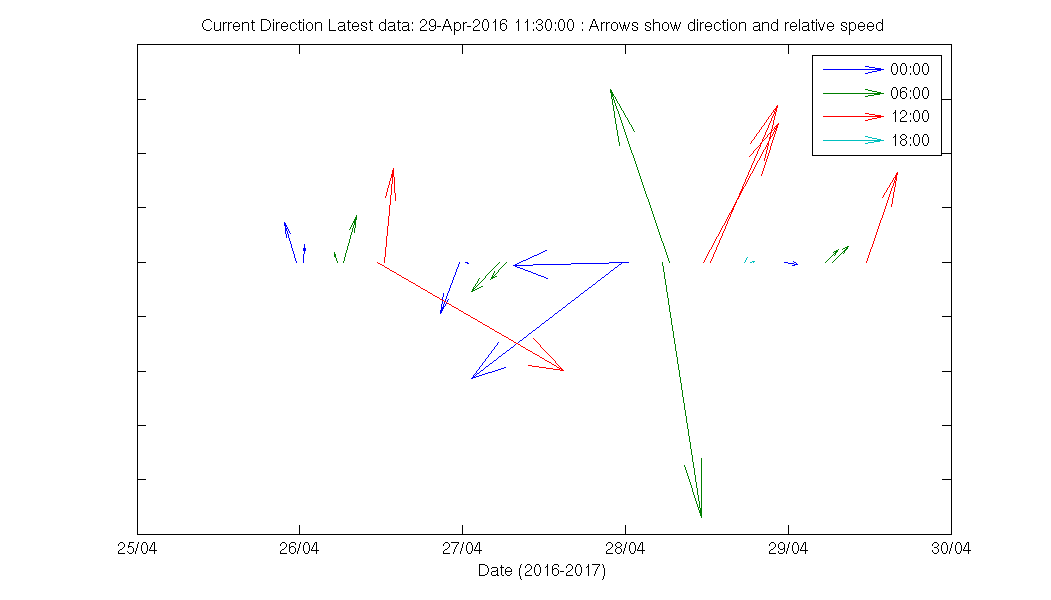
Sea Current Vectors
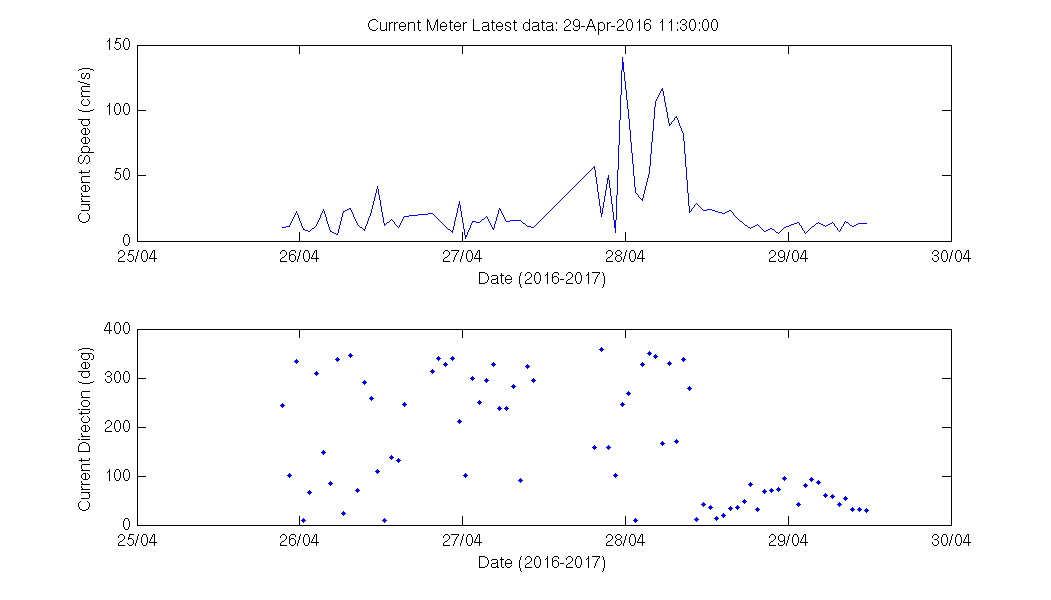
Sea Current Speed/Direction
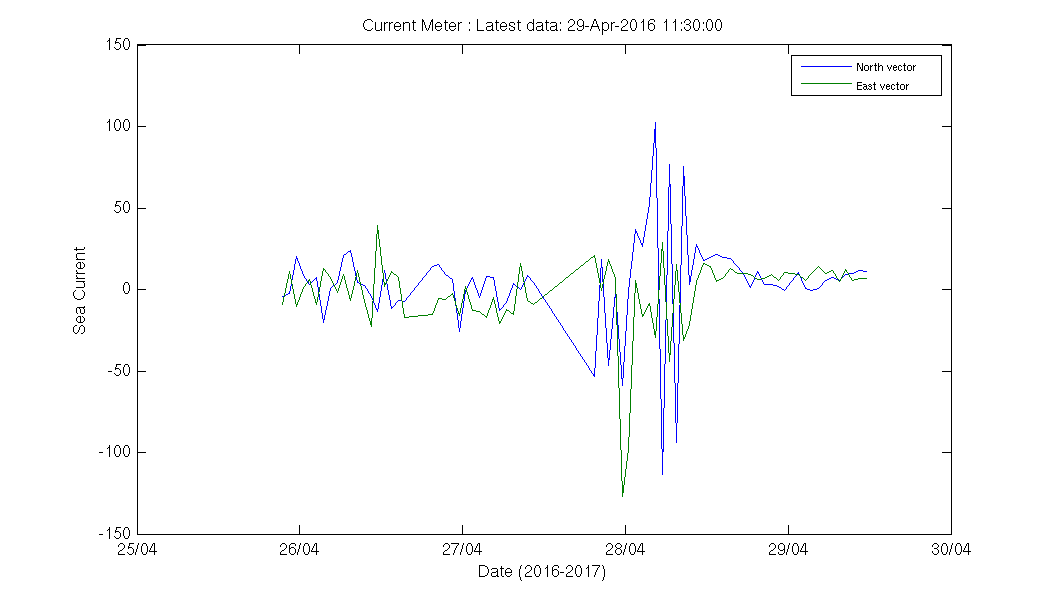
Sea Current
Irradiance 1

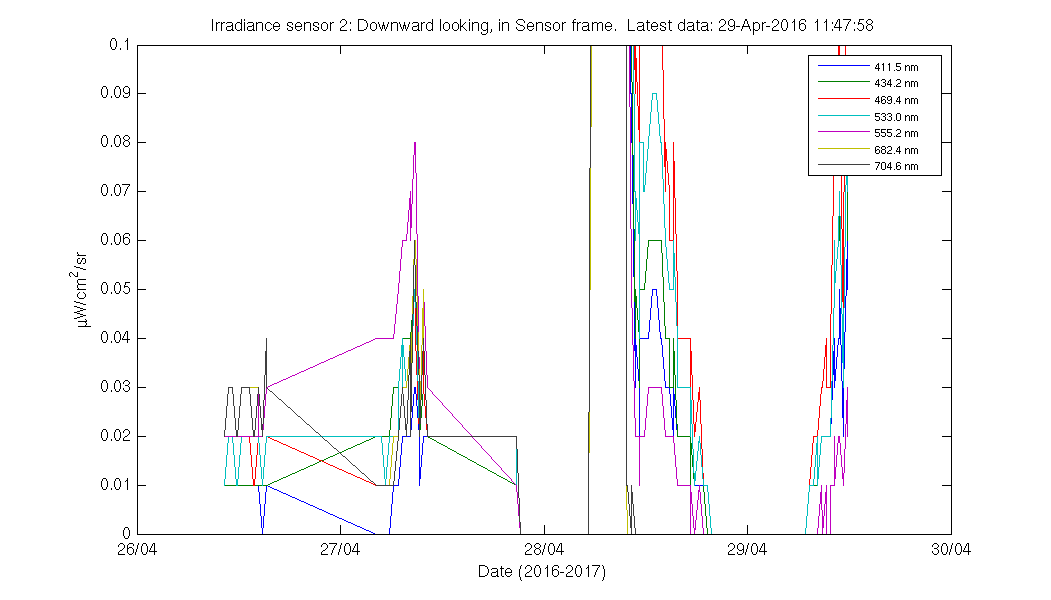
Irradiance 2
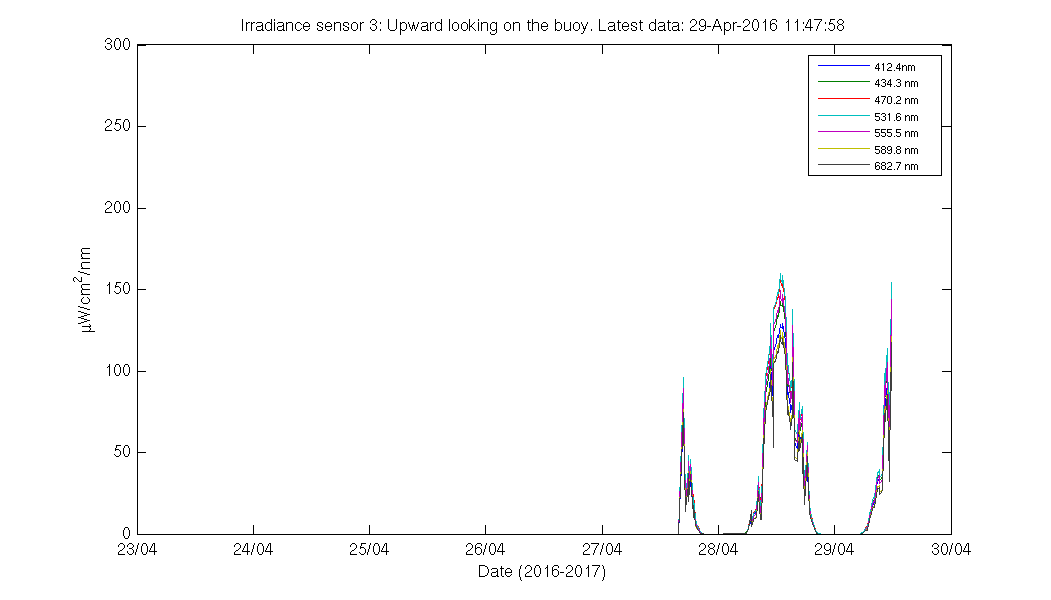
Irradiance 3
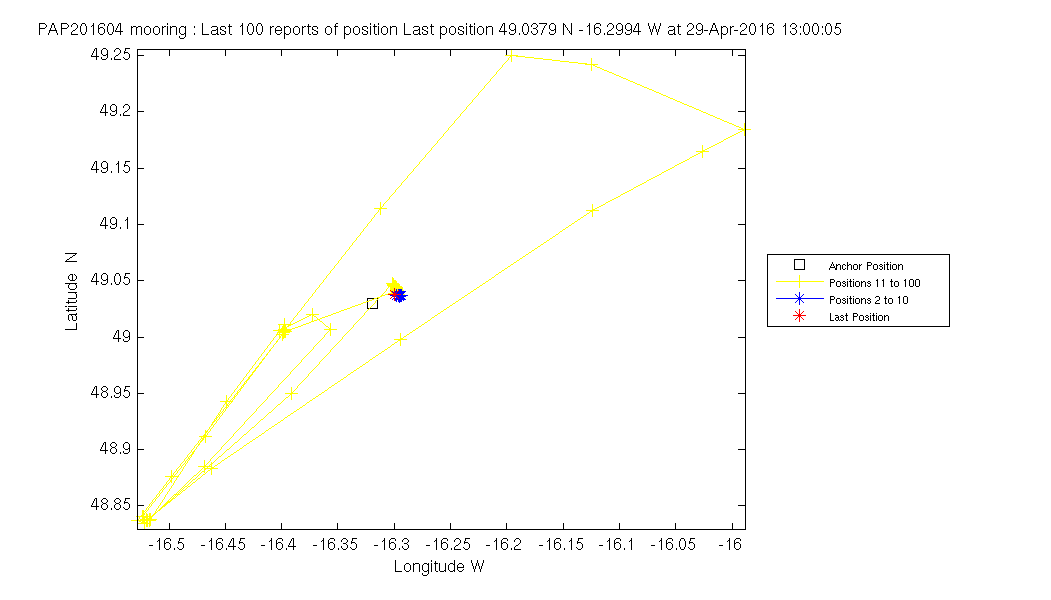
Mooring Position
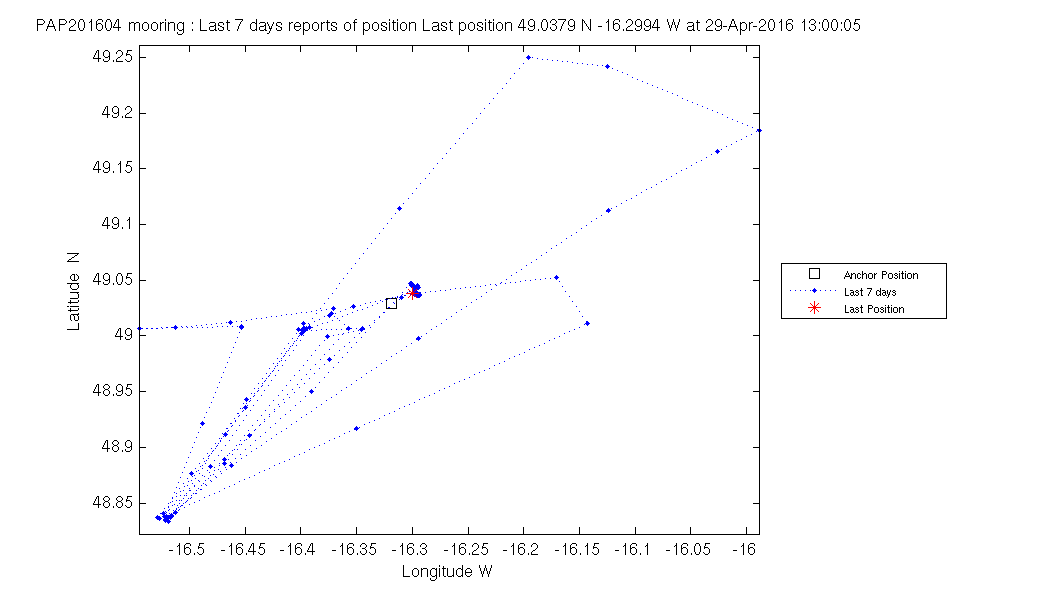
Last 7 days Track
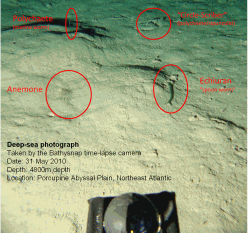
Seafloor (4800 m)
Seafloor samples have been taken at the PAP site for over 20 years. Many methods can only be achieved from research ships but some (time-lapse camera) is autonomous for high resolution long-term sampling.
| Method | Used for | Contact at NOCS, UK |
|---|---|---|
| Trawls | Megafauna (Species diversity, abundance and biomass | Dr David Billett |
| WASP | Wide-Angle Seabed Photography towed camera system | Dr Brian Bett |
| Cores | Boxcores, Mega- and Multicores for fauna and geochemistry | Prof. Andrew Gooday |
| Bathysnap | Time-lapse photography | Dr Brian Bett |