Current live data
The graphs below are generated in near real-time from data transmitted via satellite. These data have had some simple quality control measures applied in an attempt to remove spikes and invalid data. In some cases additional calibrations have been applied to the biogeochemical sensor data.
These graphs should be populated as the new mooring is put in the water in early June. The new morning will only have surface measurements
Other data are being recorded internally in some sensors on the mooring but are not transmitted in near-real time. After recovery, these data are archived at the British Oceanographic Data Centre and can be accessed at the BODC Data Collection (select ‘Porcupine Abyssal Plain Observatory Datasets’ under the ‘data collections’ tab). We are also starting to make these data available through the BODC ERDDAP service. To see the full time series, make sure to set the ‘start time’ to the earliest possible date (by default only the latest data are shown).
The latest received data from the PAP site was recorded on * Add page to ‘AJAX fetch’ block config *
Instrument data telemetered from the PAP-1 buoy
Click on any chart to see a larger version.
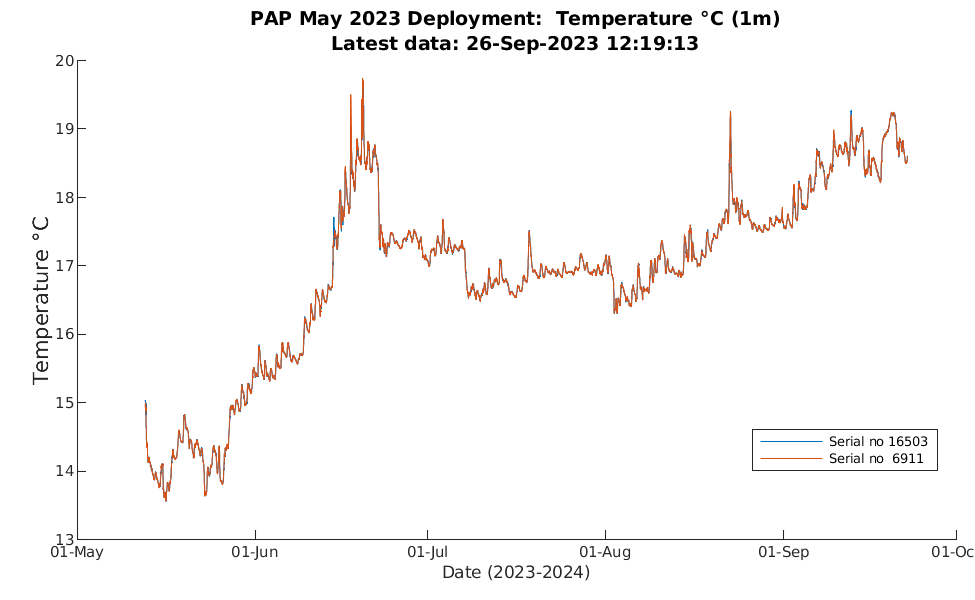
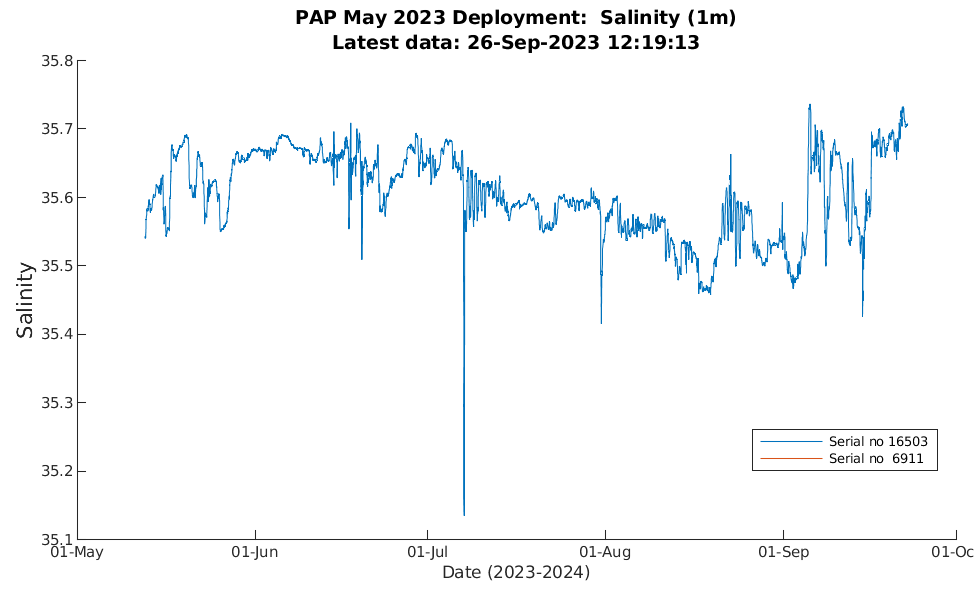
Temperature and salinity
Surface temperature
Surface salinity
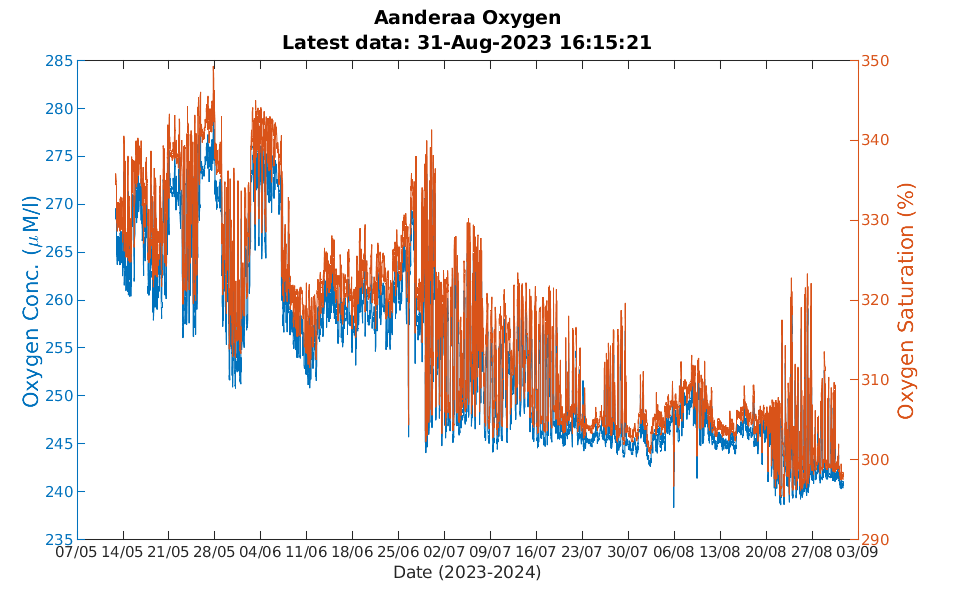
Oxygen
Oxygen at 1m (Aanderaa)
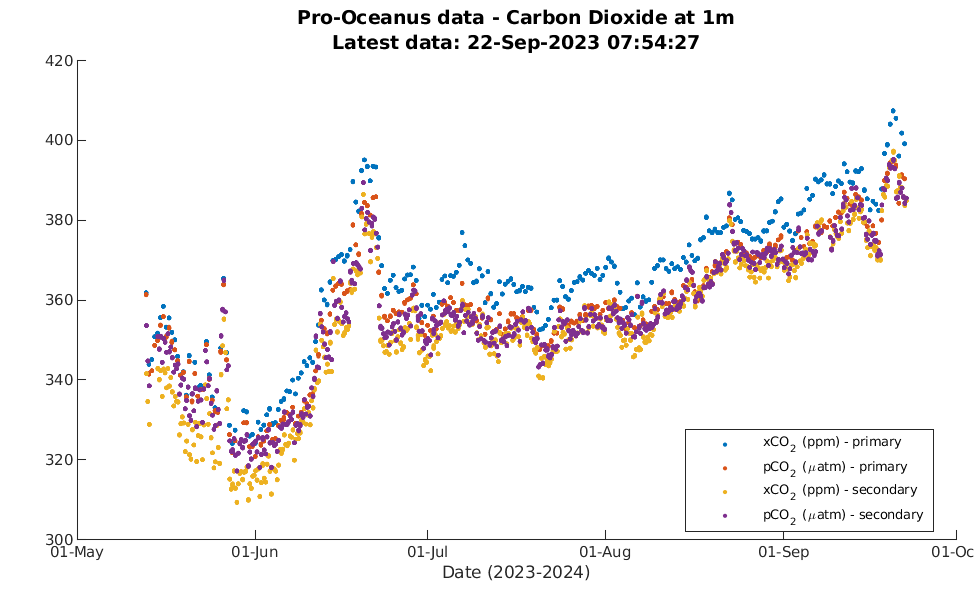
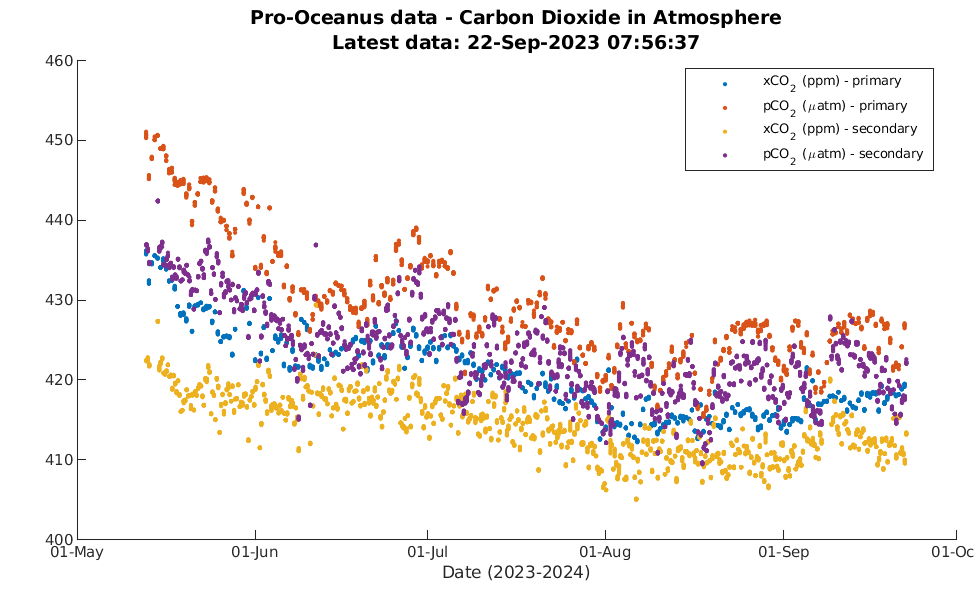
Carbon dioxide
Carbon dioxide at 1m
Carbon dioxide in air
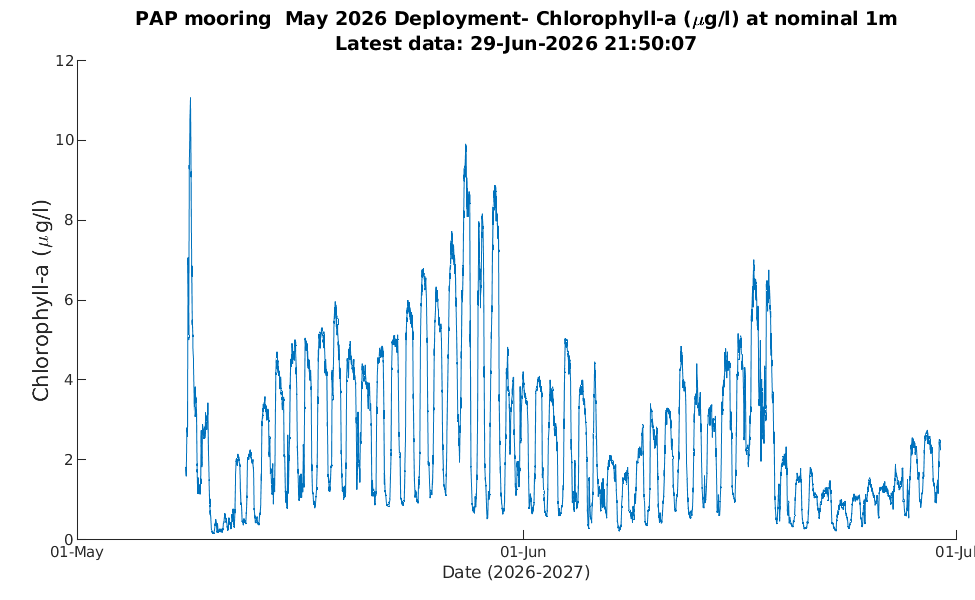
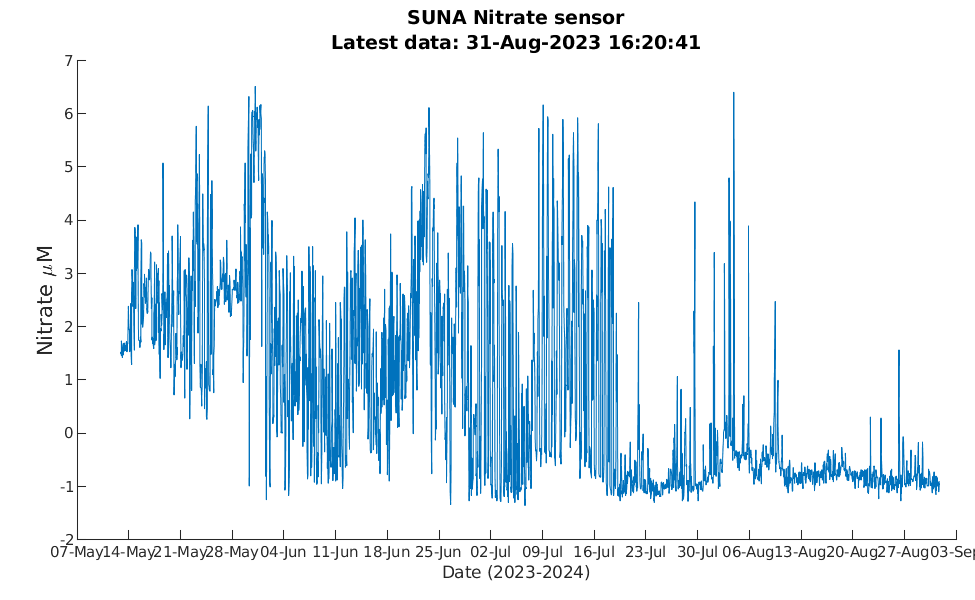
Chlorophyll-a and Nitrate
Chlorophyll (ECO)
Nitrate at 1m (SUNA)
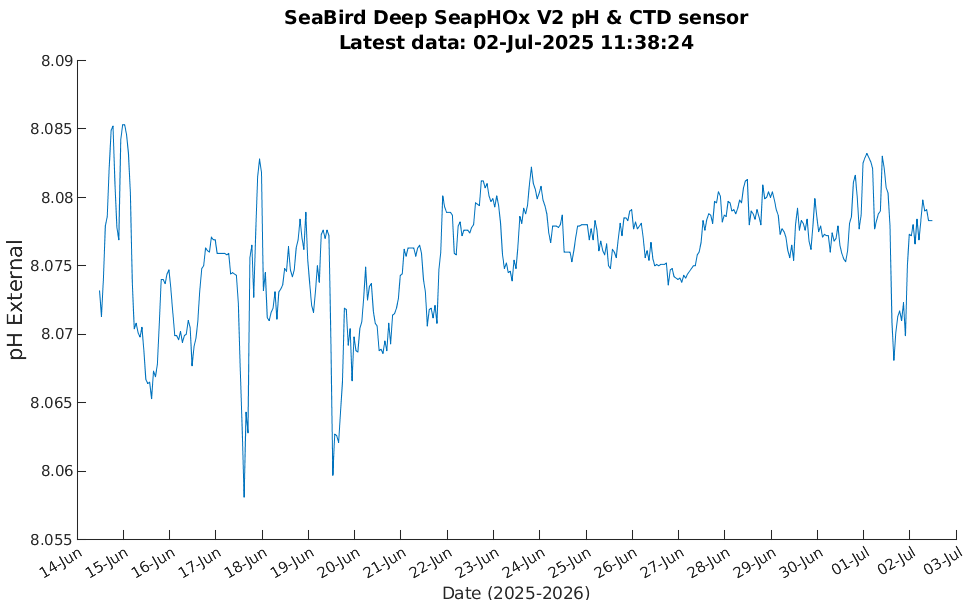
pH
pH at 1m
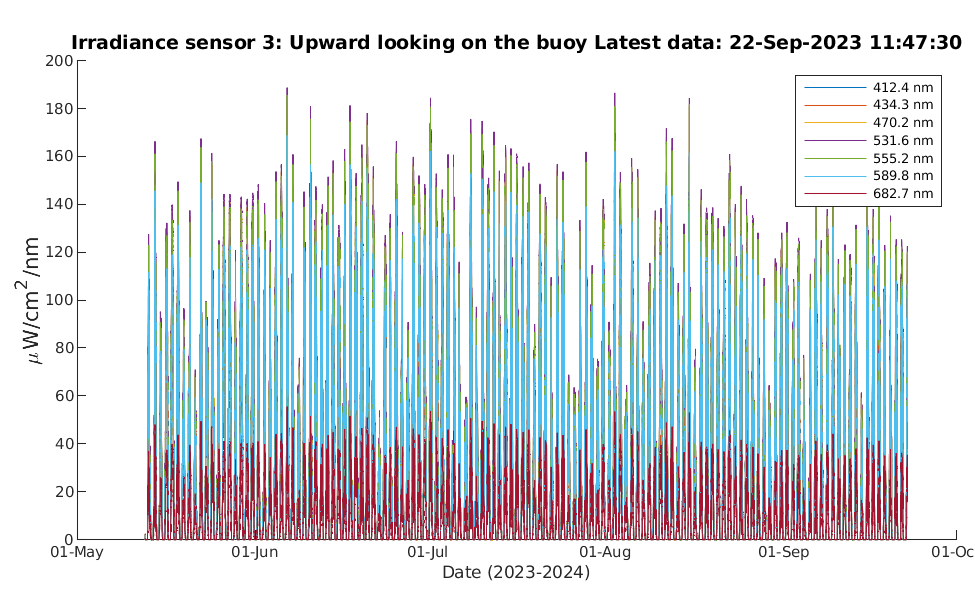
Surface irradiance
Irradiance 3
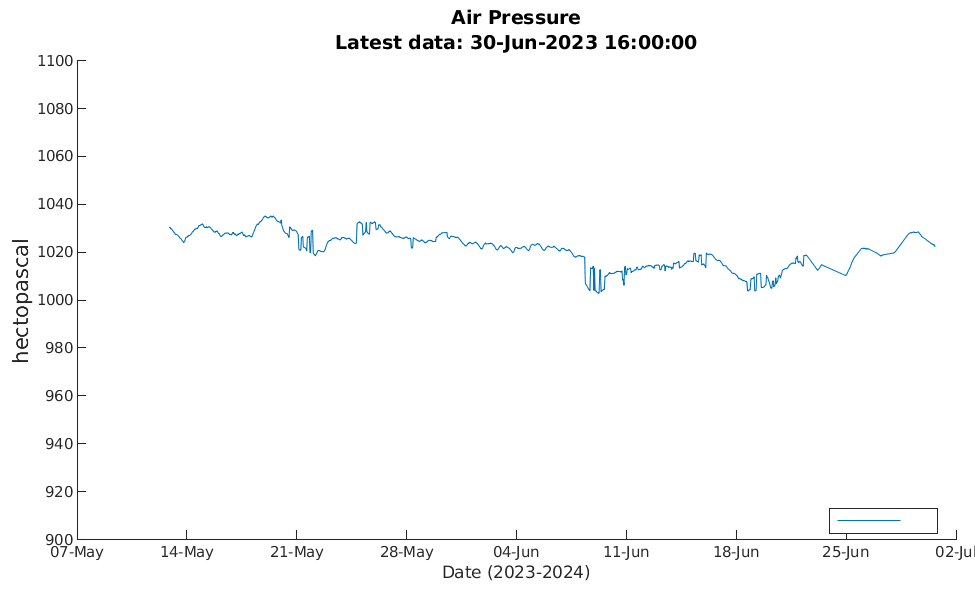
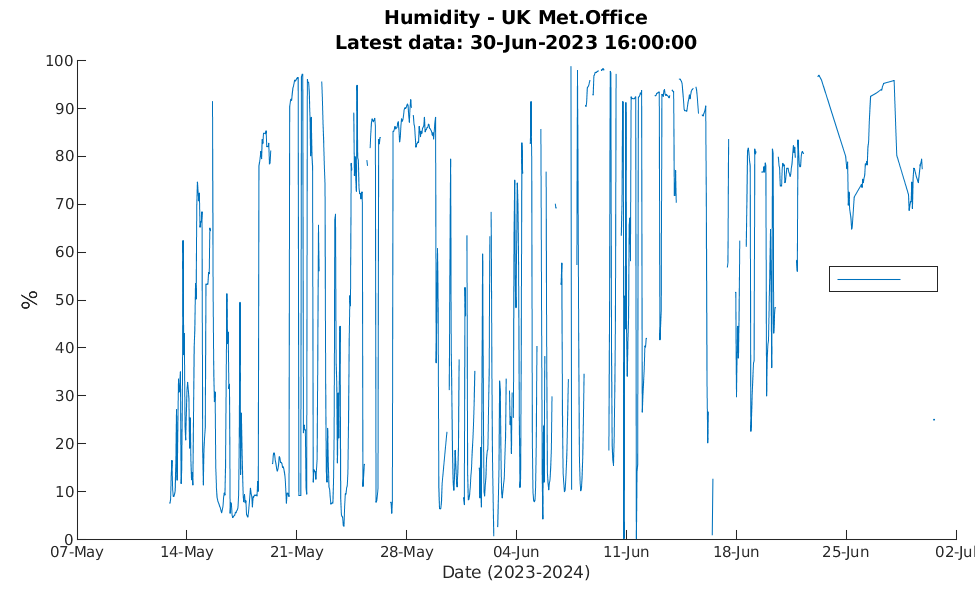
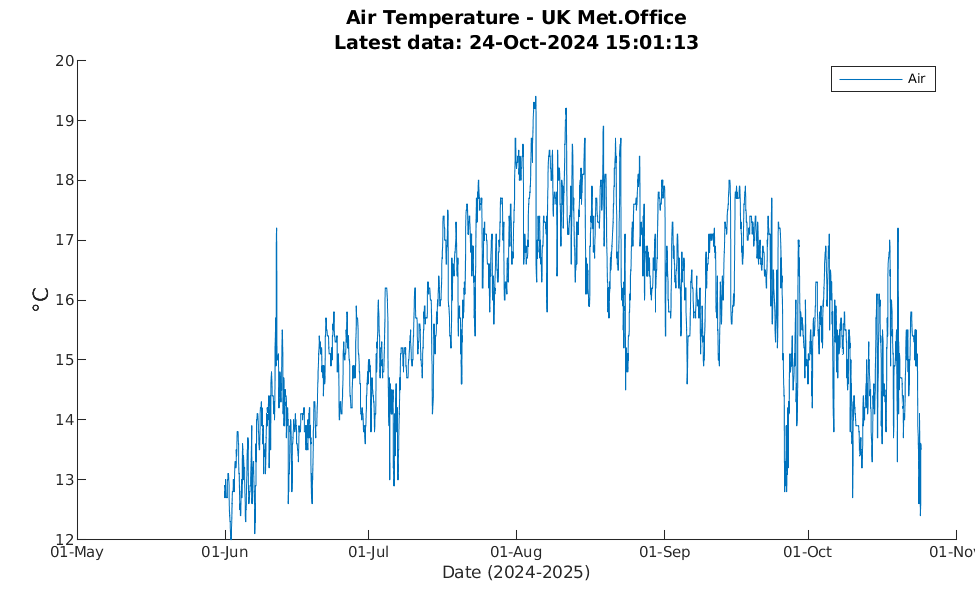
MetOffice UK meteorological data
PAP is part of the MetOffice network of weather buoys: view the full network.
Air pressure
Humidity
Air Temperature
Wind speed
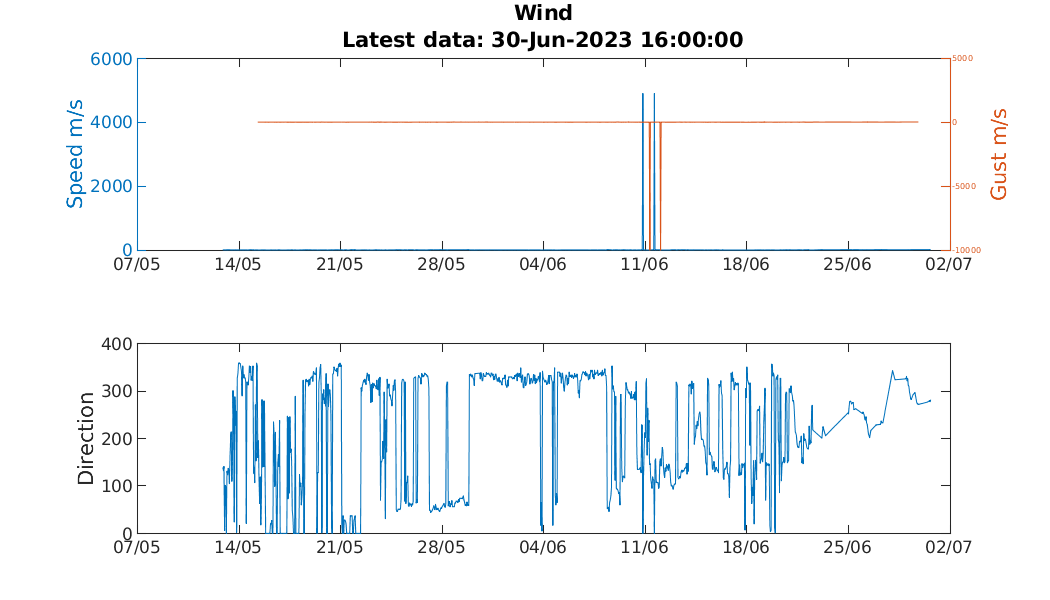
Wind vectors
![]()
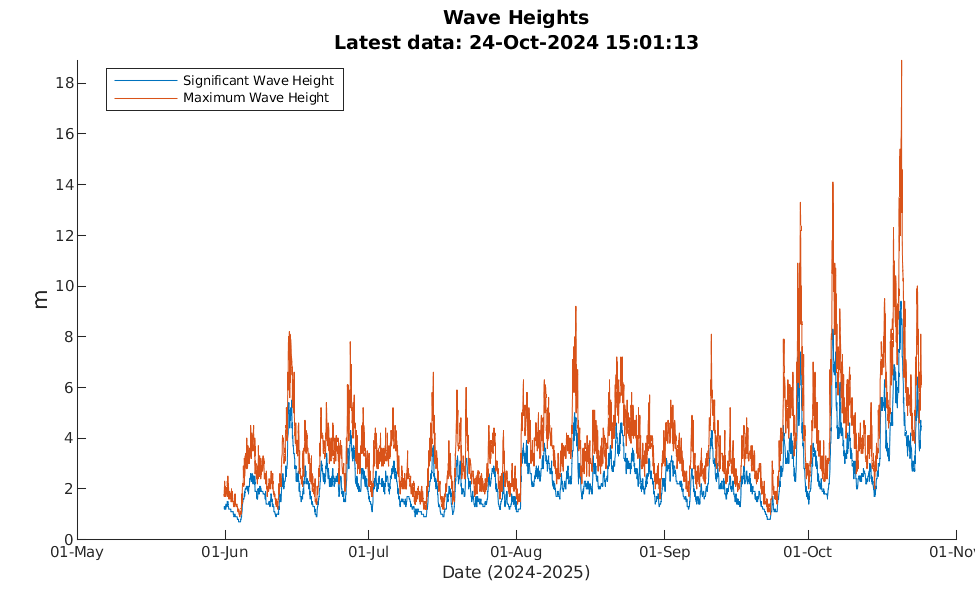
Wave height
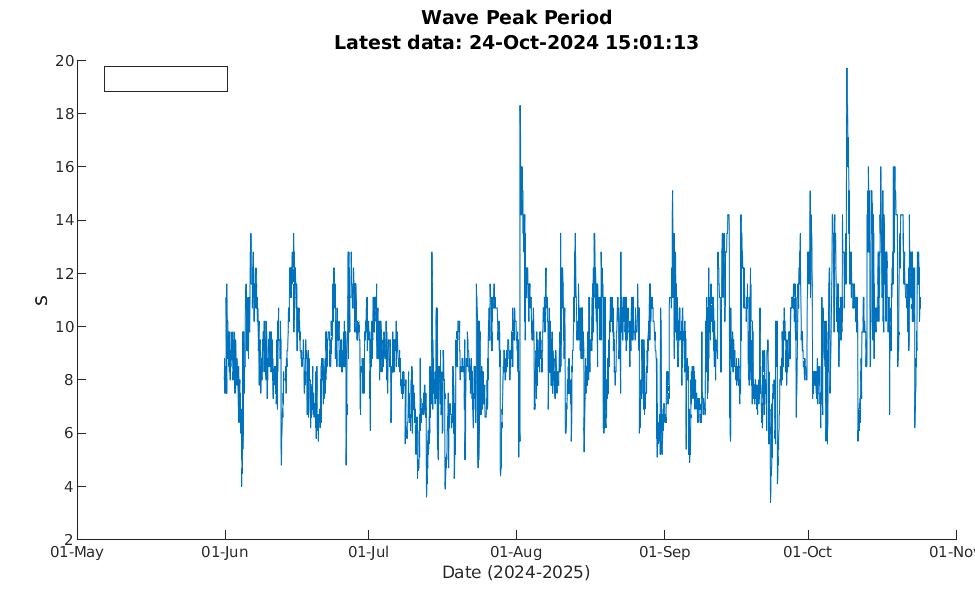
Wave peak period
Wave vectors
![]()
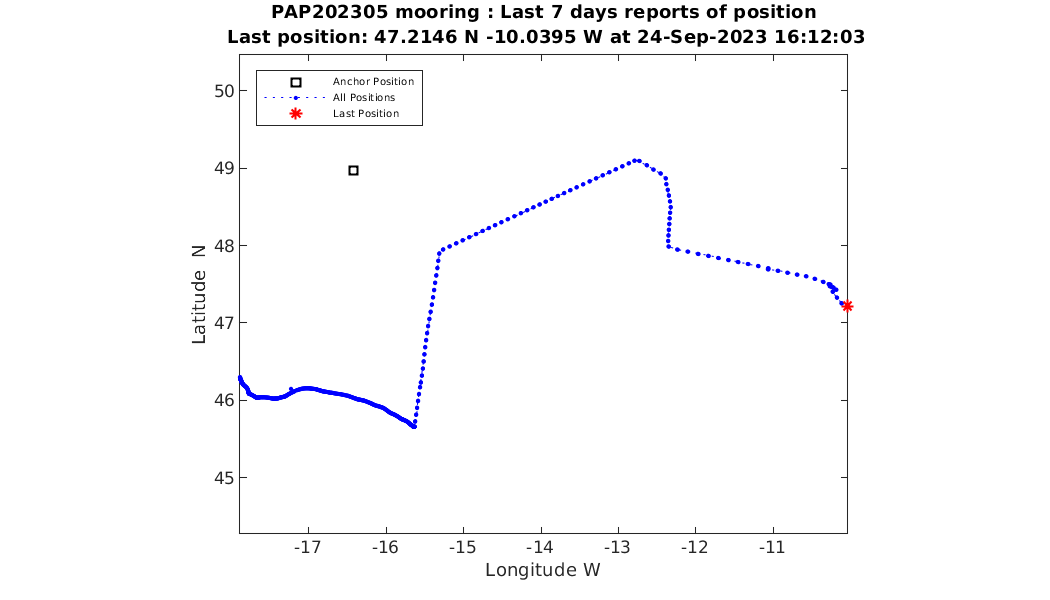
Mooring position
Mooring position
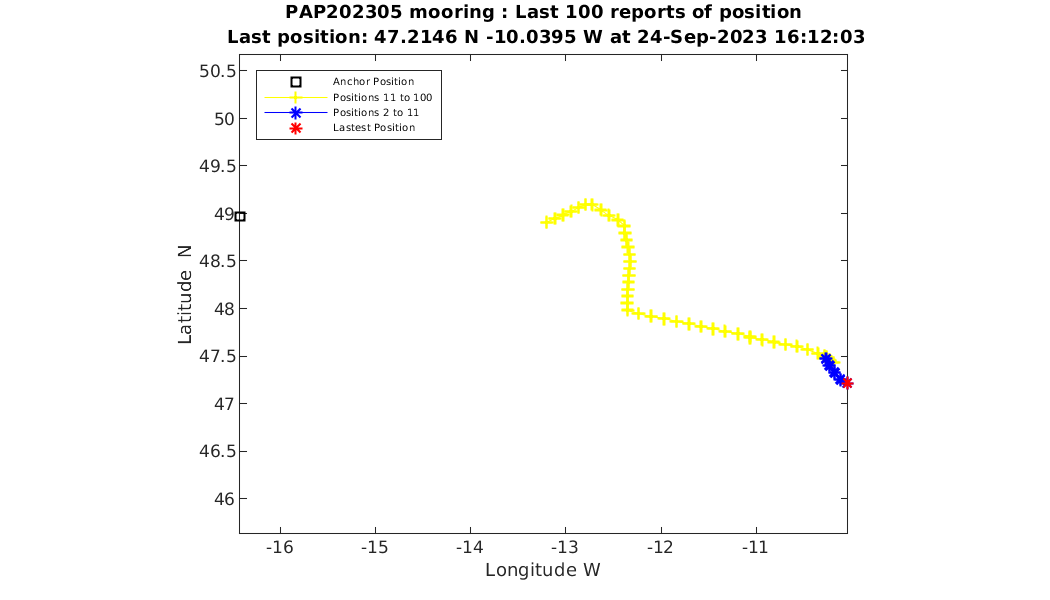
Last 7 days track
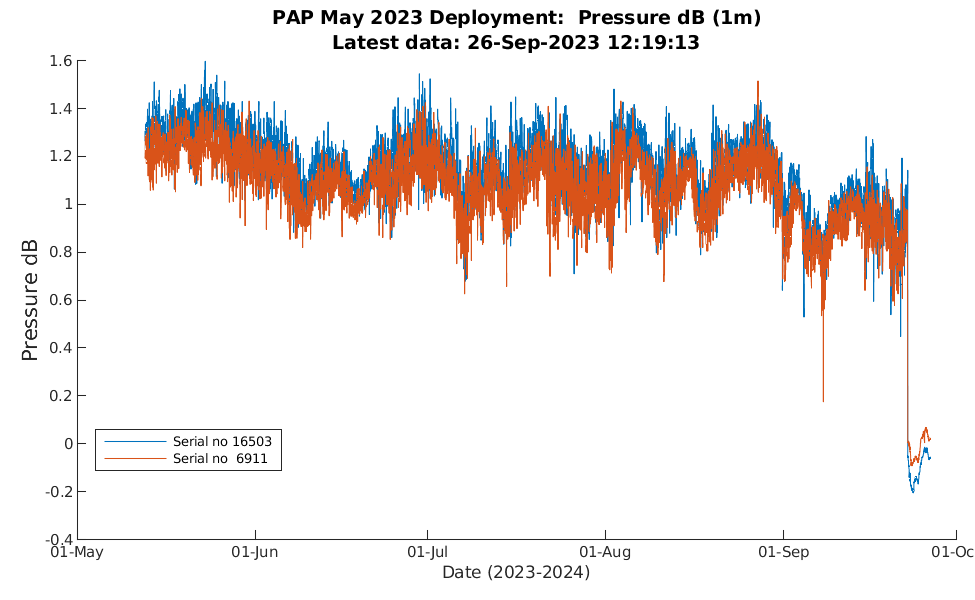
Surface pressure
| PAP1 mooring | Contact at NOC |
|---|---|
| Biogeochemical sensors | Dr Sue Hartman |
The raw data can be accessed via the NOC anonymous FTP server. If this link does not work directly, please use an ftp application to connect to server ftp.noc.soton.ac.uk (user anonymous) then navigate to /animate/pap/PAP_deploy_2025.