The July 2015 mooring was deployed on cruise DY032.
Below are the graphs generated in near-real time from data gathered at PAP and transmitted via iridium servers.
After recovery, data were archived at the British Oceanographic Data Centre (BODC) and can be accessed at: BODC PAP Collection
Click here to view engineering graphs
Oceanographic instruments on keel and at 30m on frame, operating in near real time
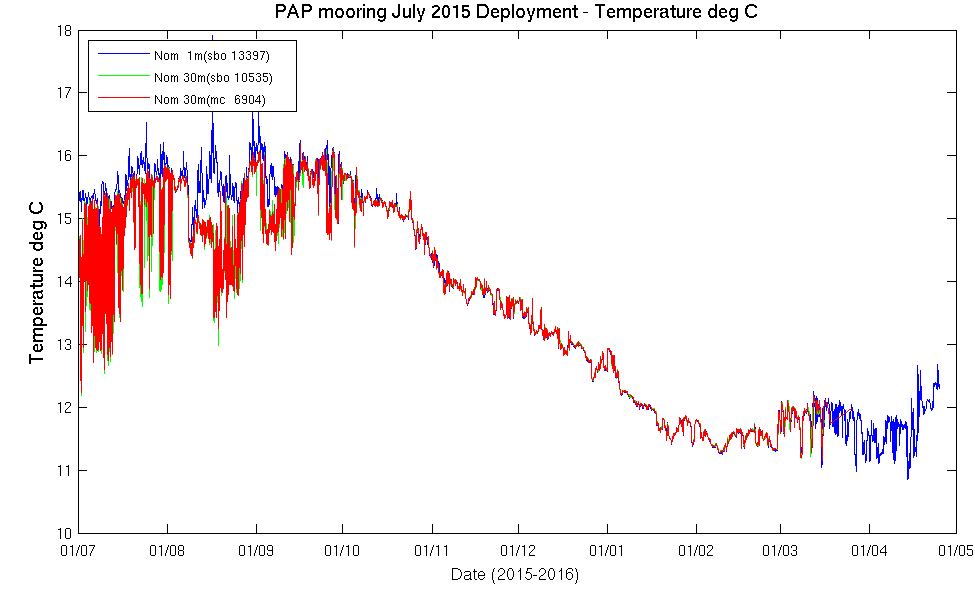
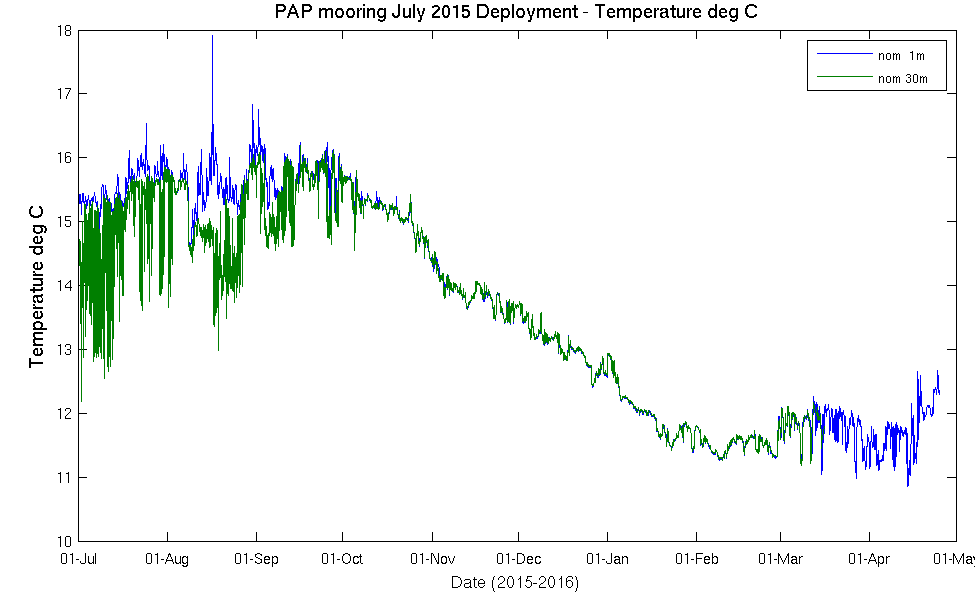
Temperature
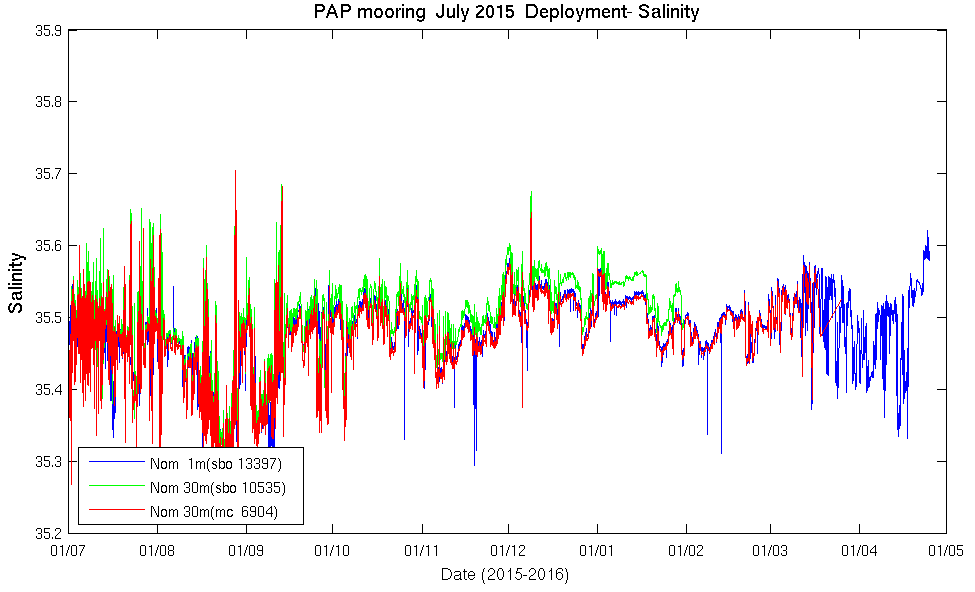
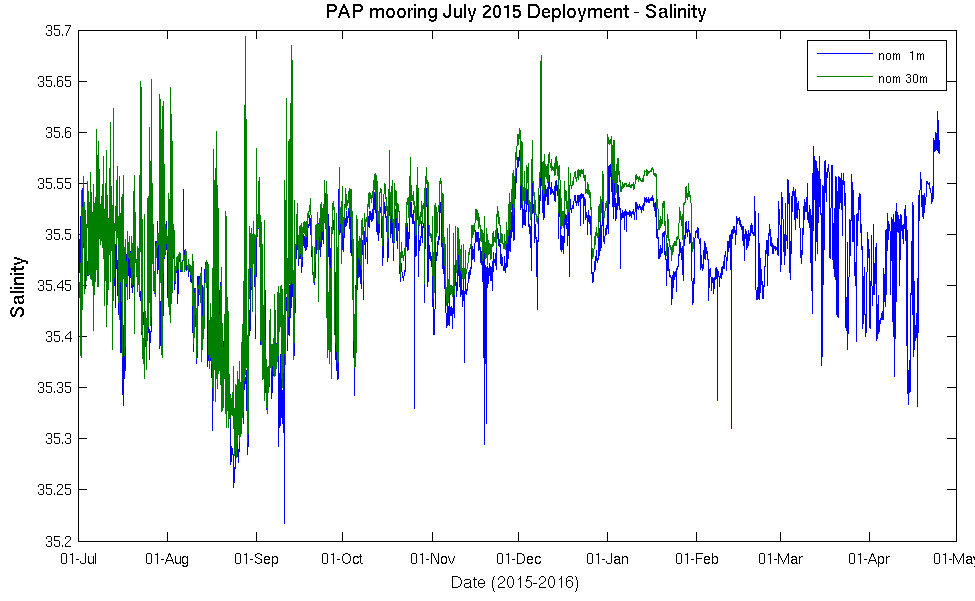
Salinity
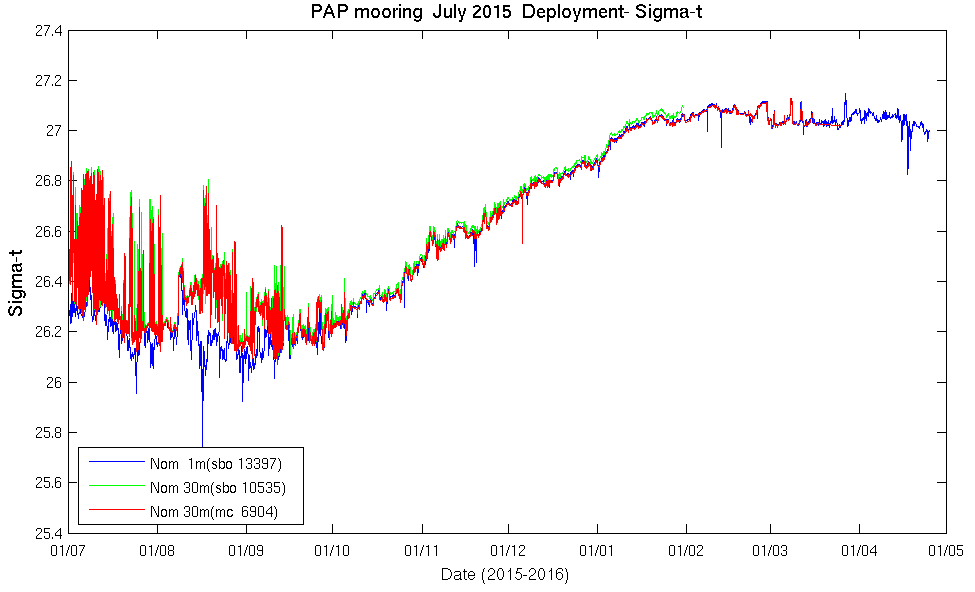
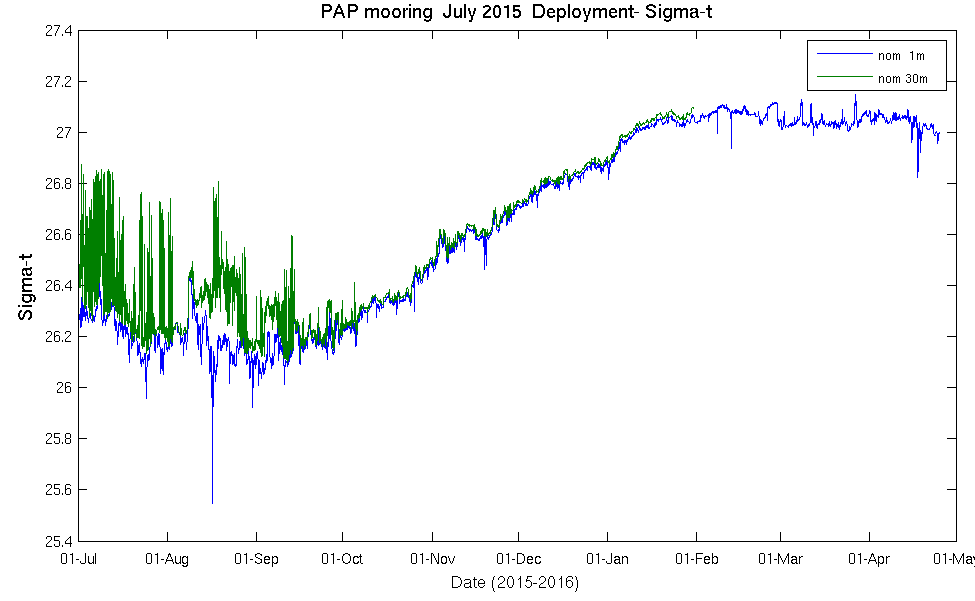
Sigma-t
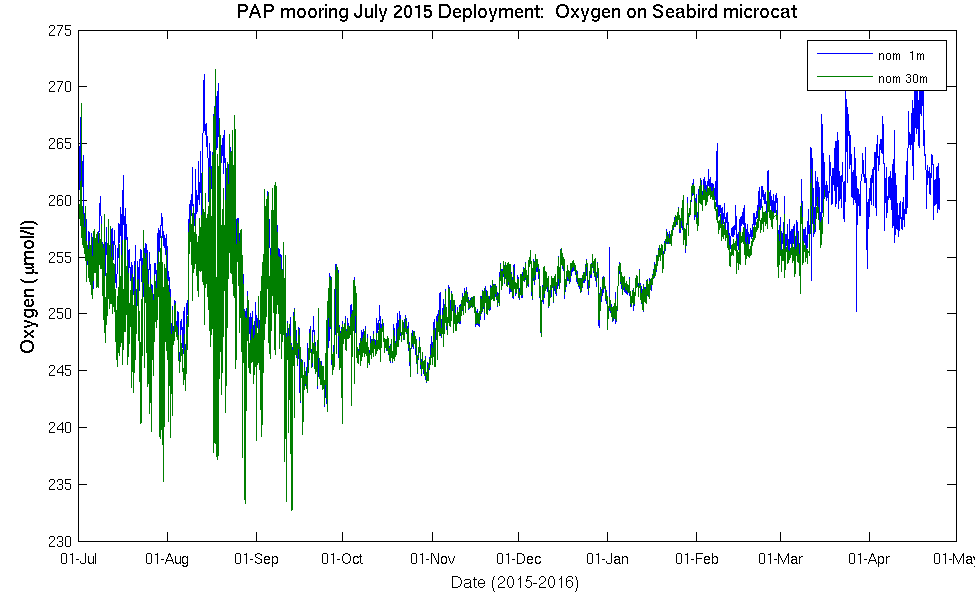
Microcats with Oxygen
Temperature
Salinity
Sigma-t
Seabird Oxygen
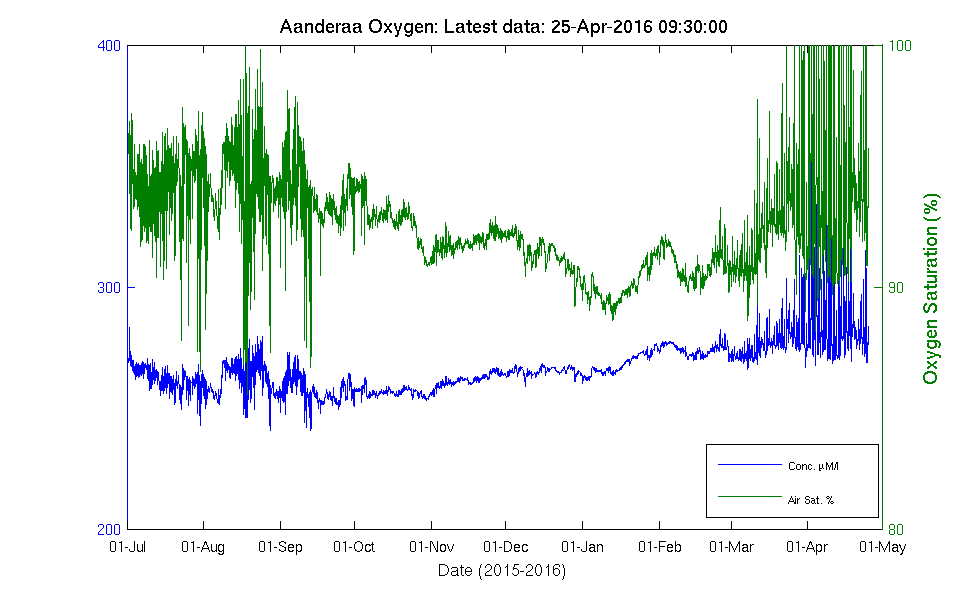
Aanderaa Oxygen
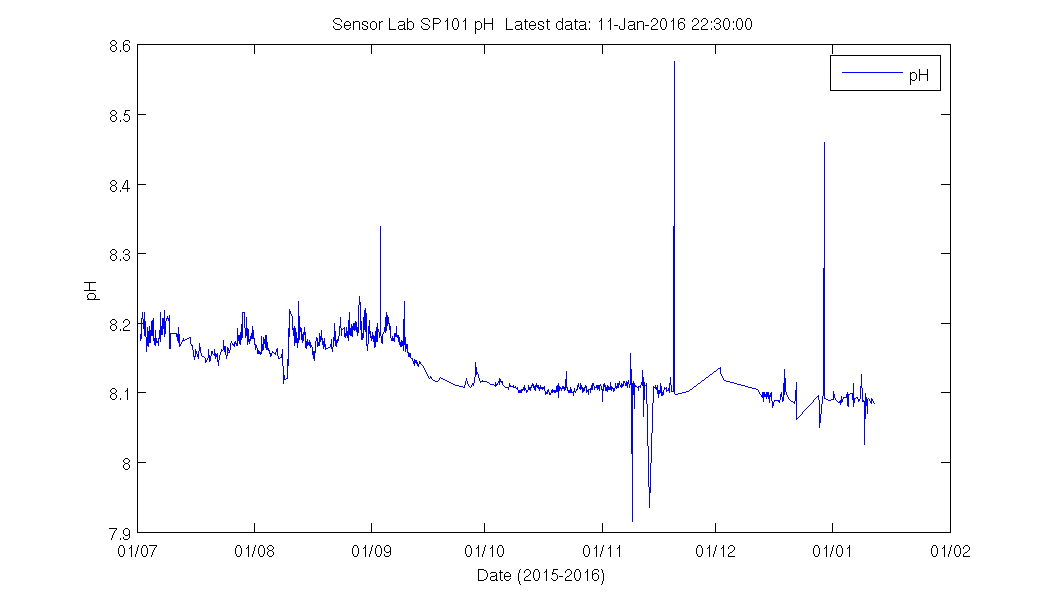
Sensor Lab SP101 pH
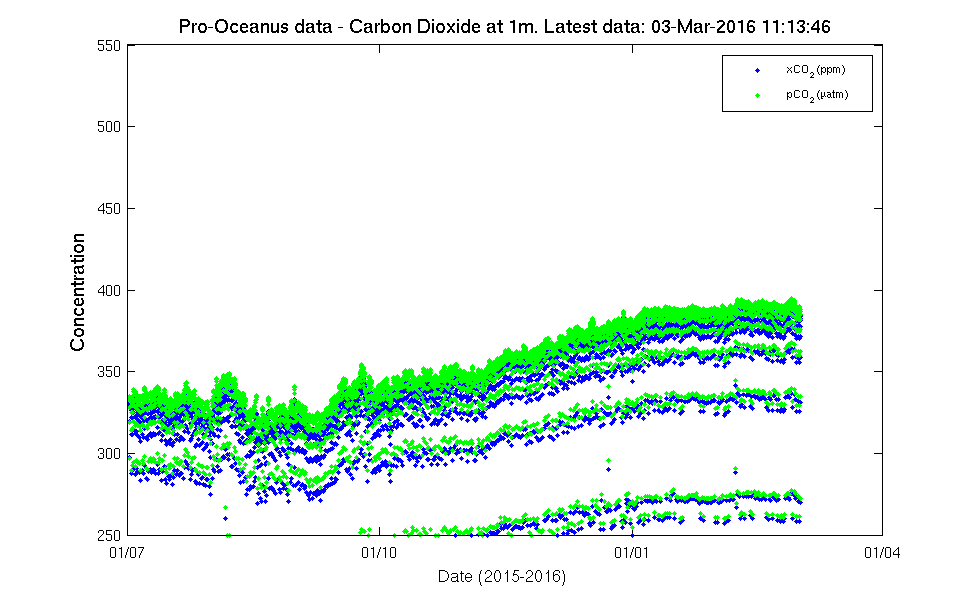
Carbon Dioxide at 1m
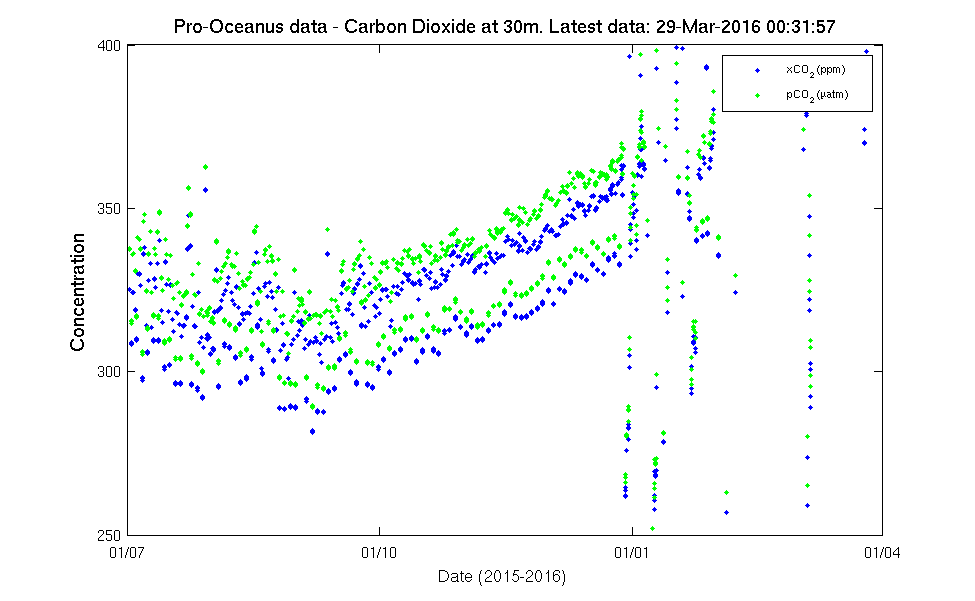
Carbon Dioxide at 30m
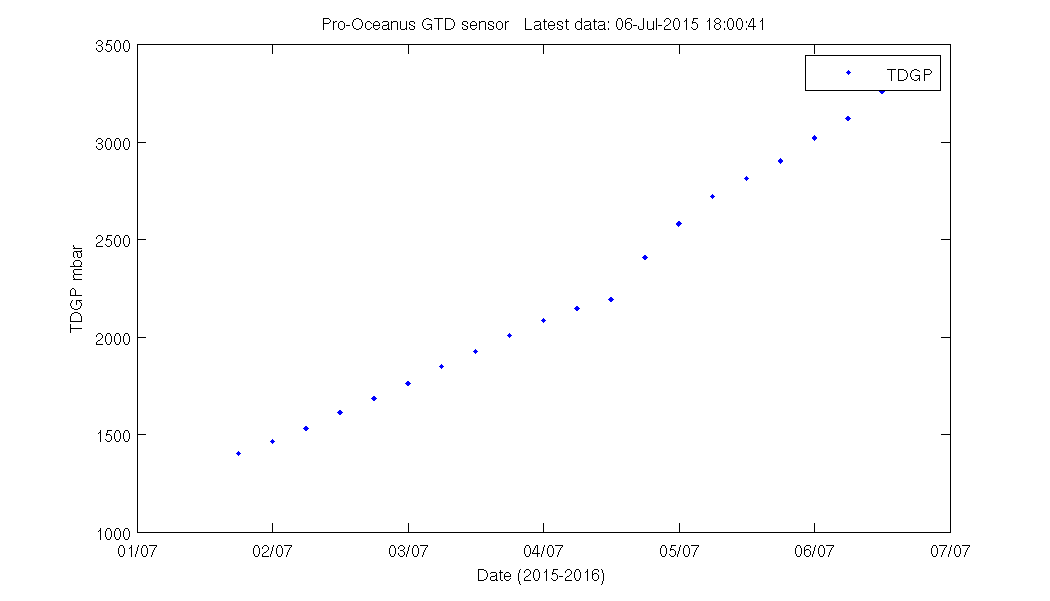
Pro-oceanus GTD-Pro at 30m
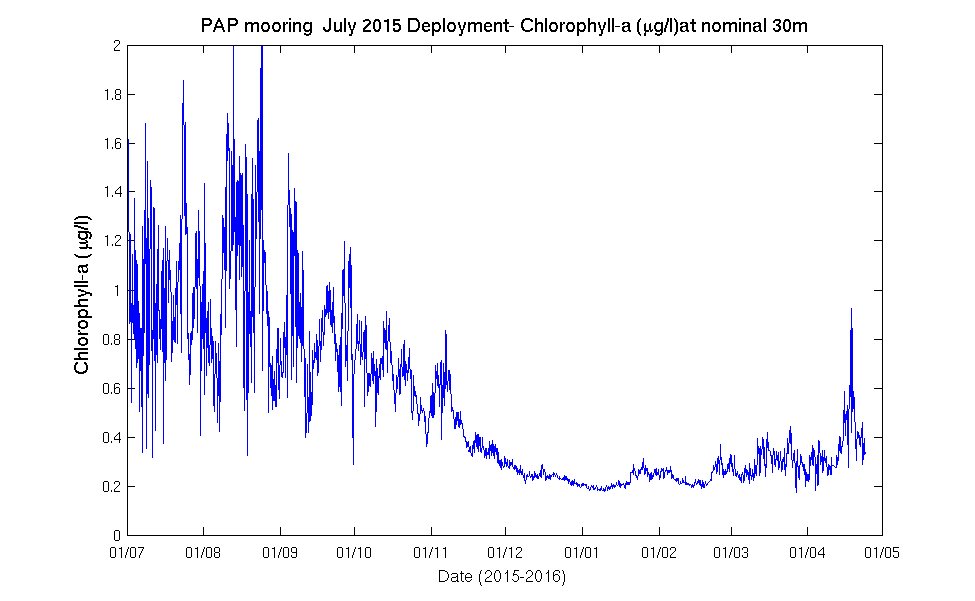
Chlorophyll-a Wetlabs
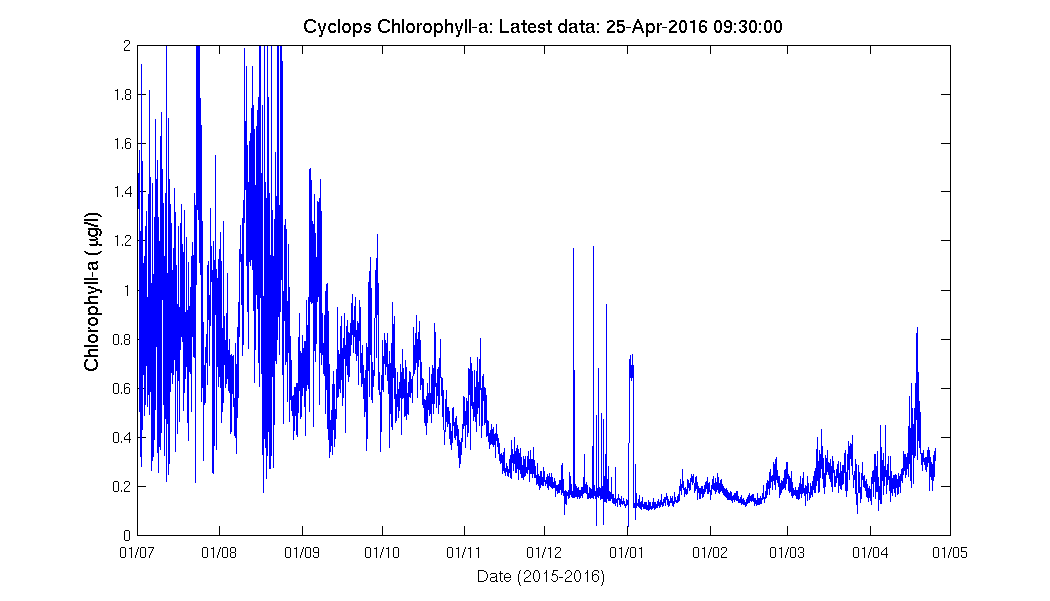
Fluorescence Cyclops
ISUS Nitrate at 30m

Satlantic pH
Internal
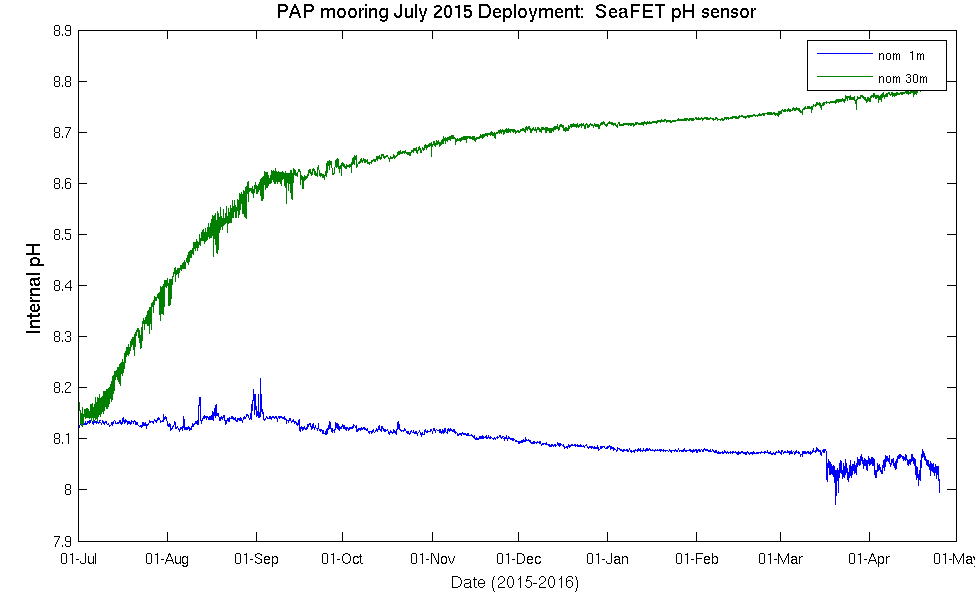
External
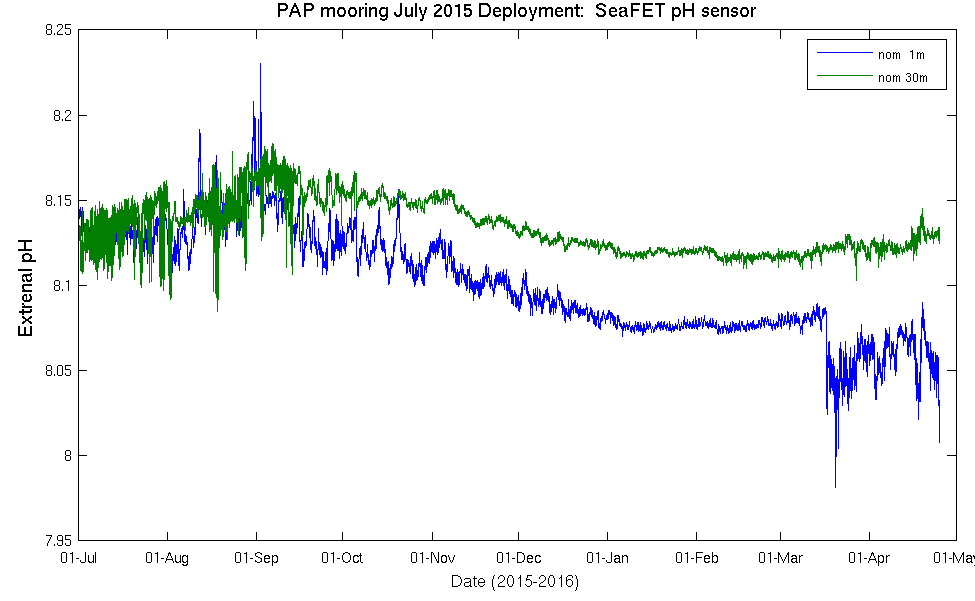
Sensor Sn 257 (at 1m)
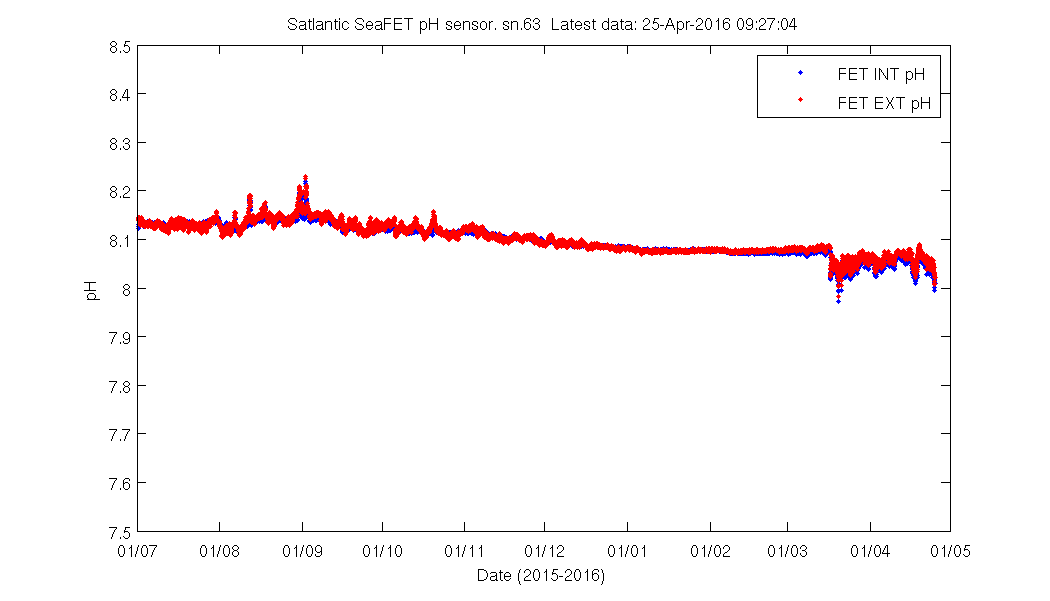
Sensor Sn 63 (at 30m)

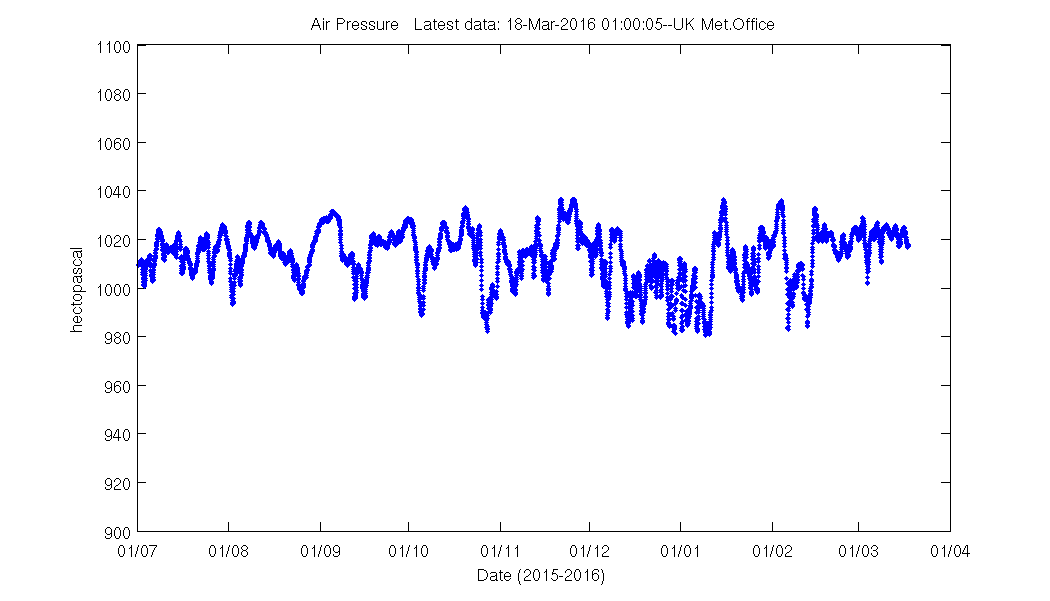
MetOffice UK Meteorological Data
Air Pressure
Humidity

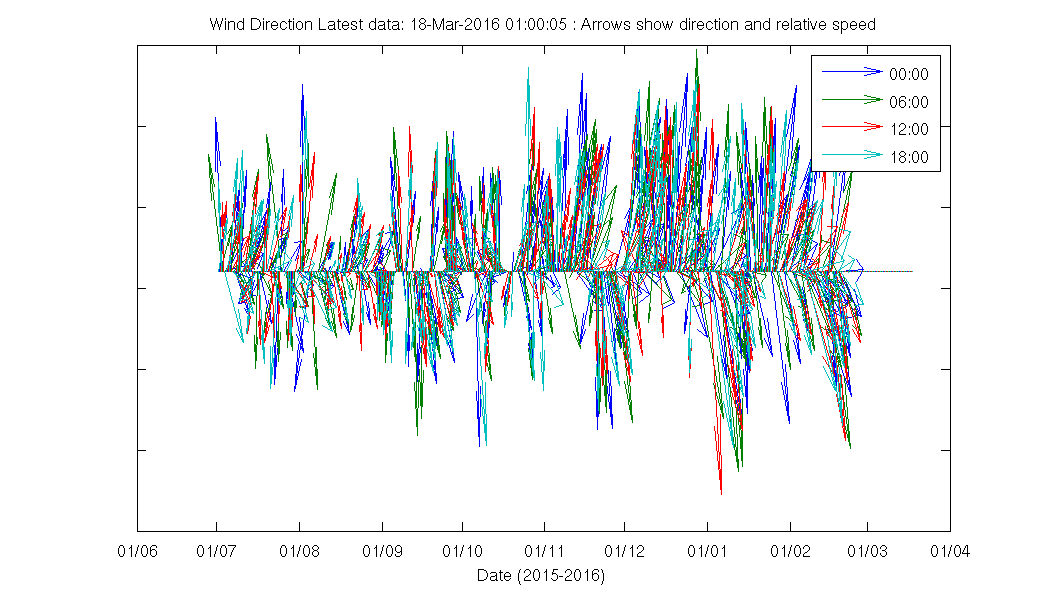
Wind Speed/Direction
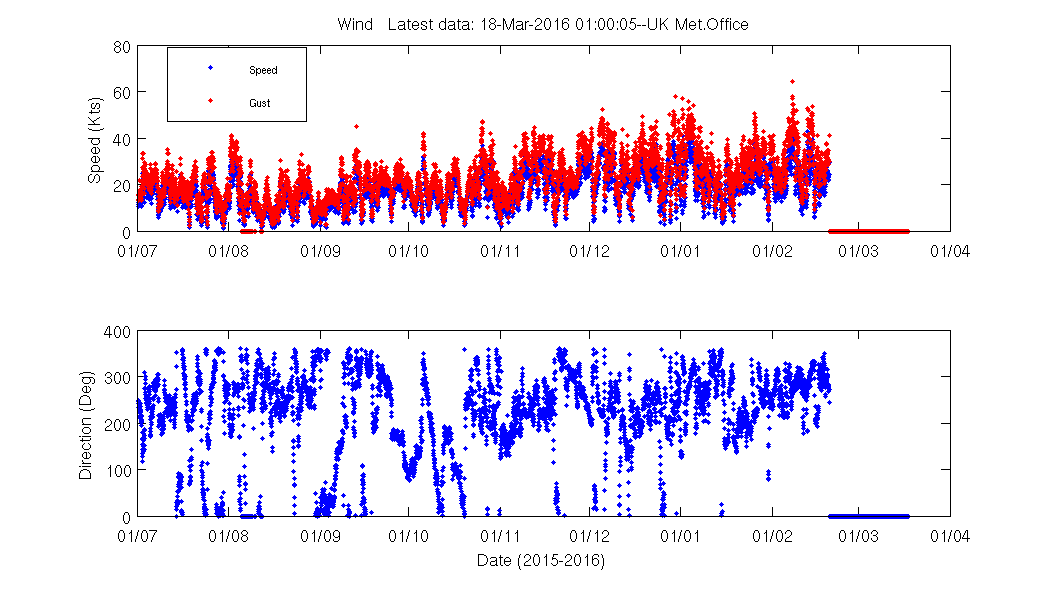
Wind Vectors
Wave Height

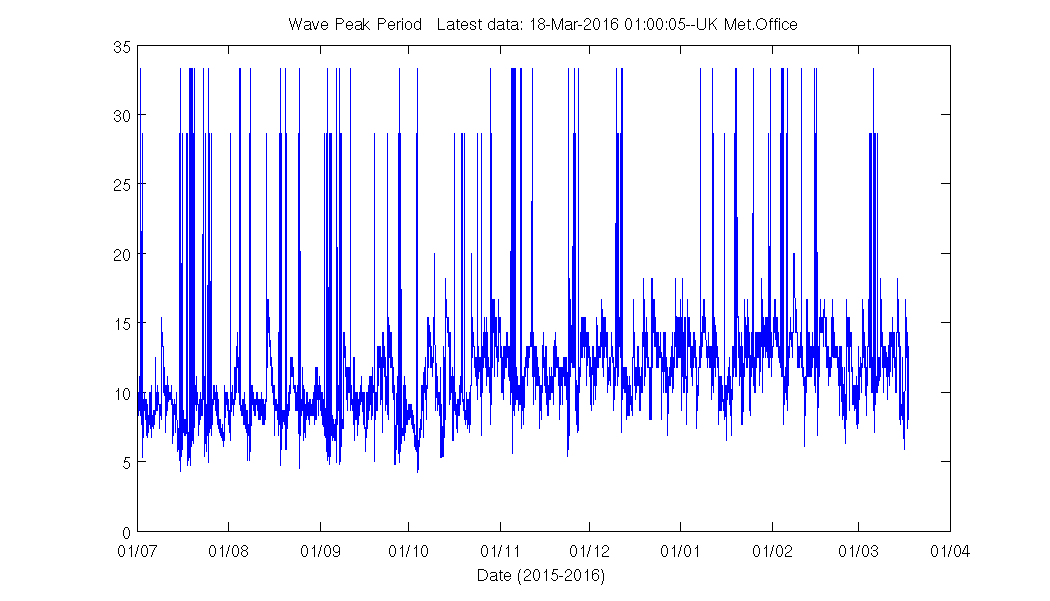
Wave Peak Period
Wave Vectors
![]()
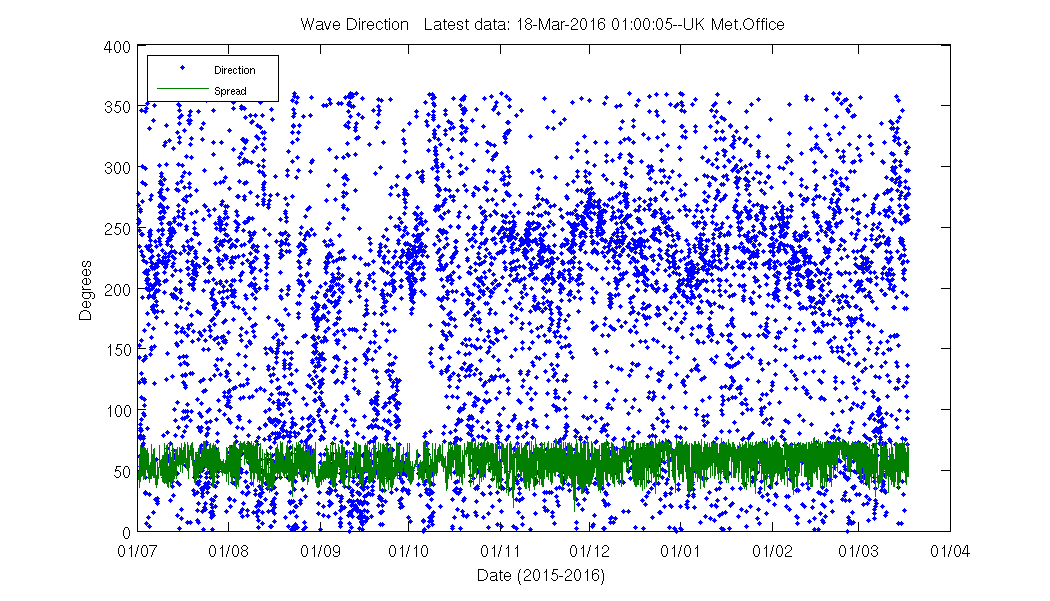
Wave Direction
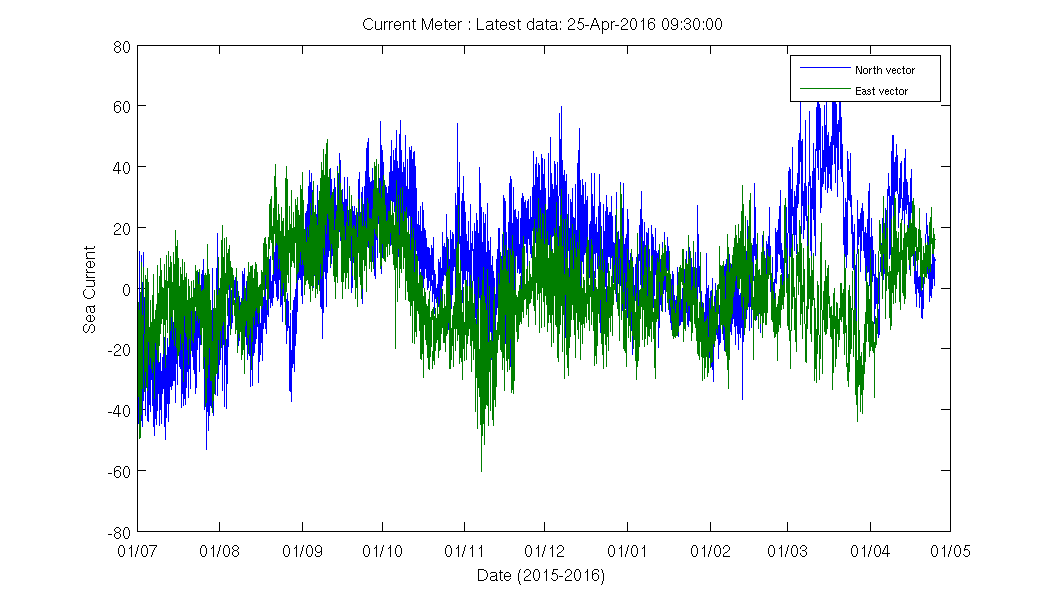
Sea Current Vectors

Sea Current Speed/Direction
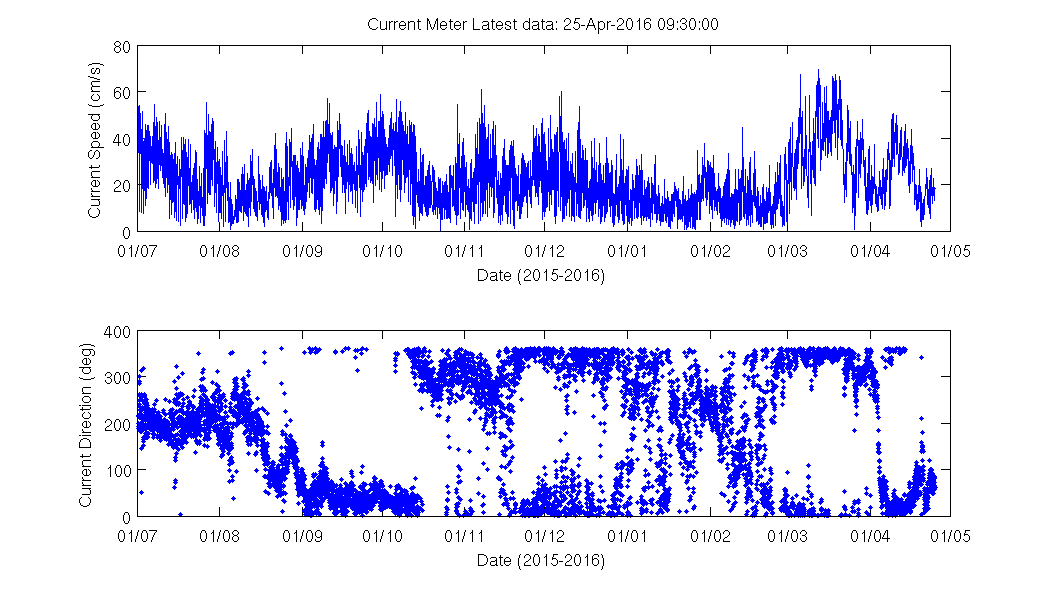
Sea Current
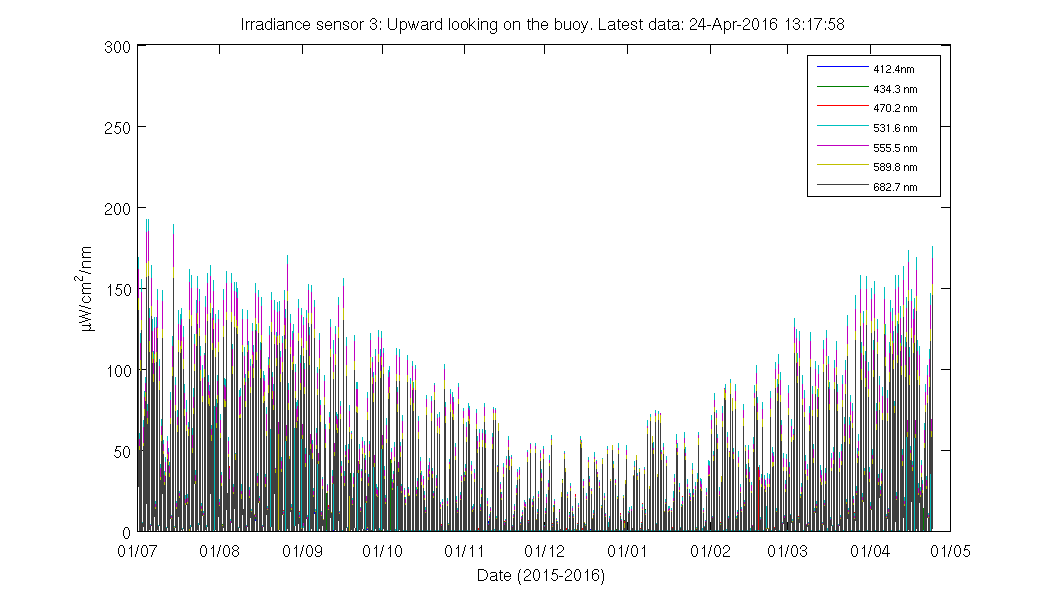
Irradiance 3
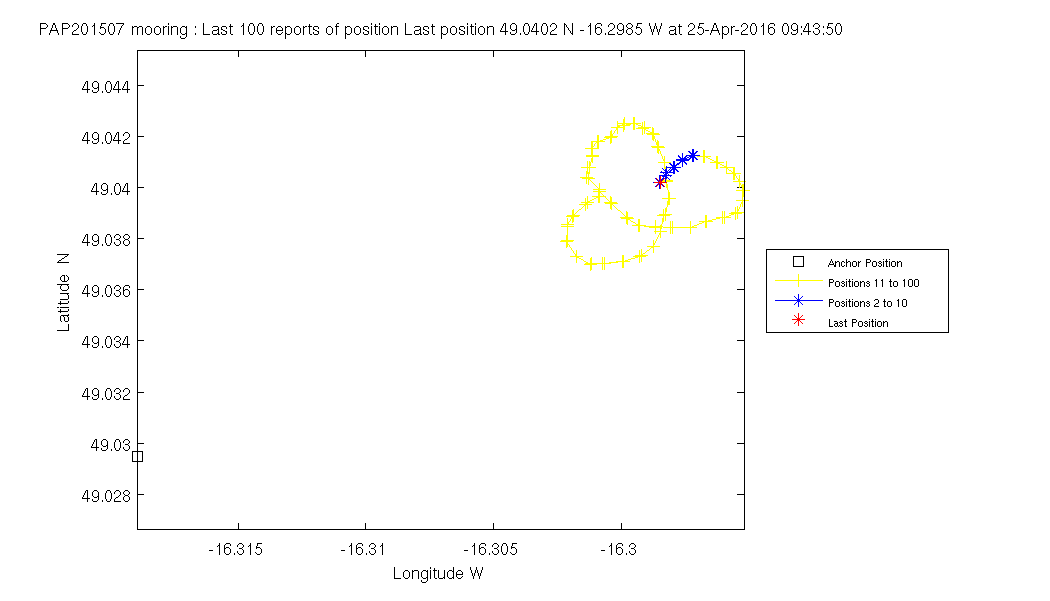
Mooring Position
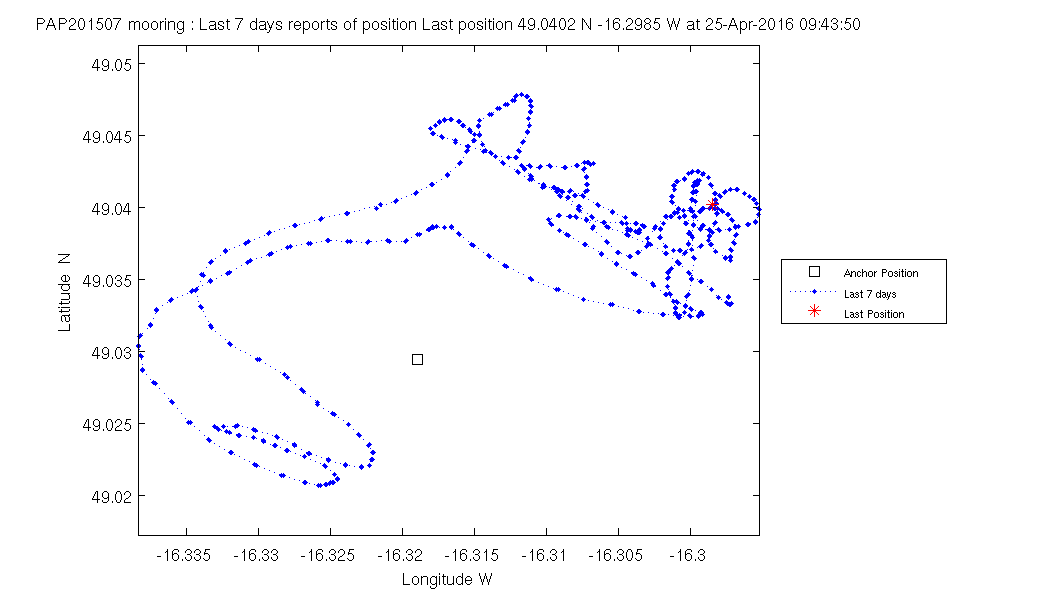
Last 7 days Track
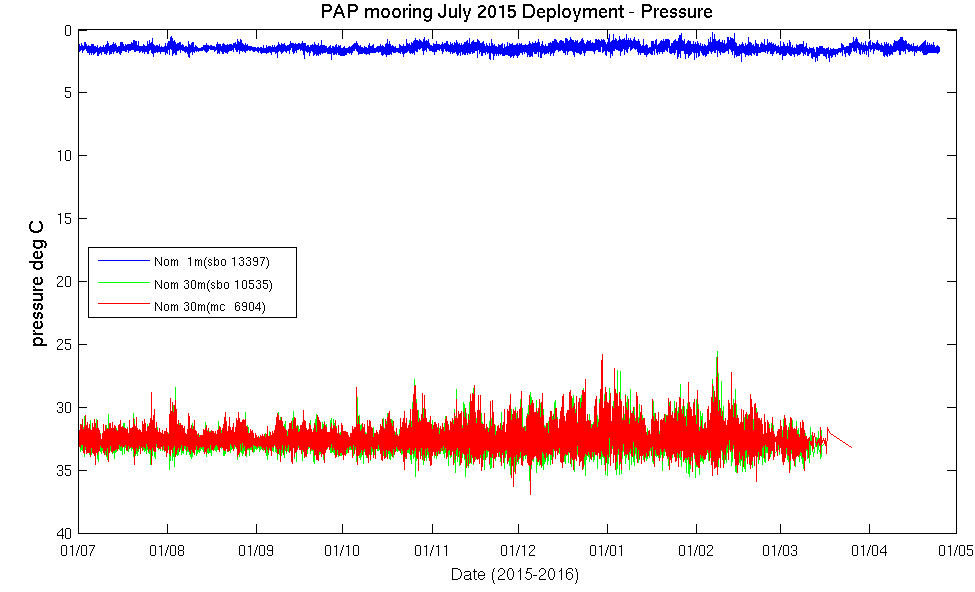
SBO Pressure