June 2004
The Research Vessel Charles Darwin successfully recovered and redeployed the 3 PAP moorings.
After recovery, data were archived at the British Oceanographic Data Centre (BODC) and can be accessed at: BODC PAP Collection, (please use the search term Porcupine or #5192 to find our data) and temperature, salinity, conductivity and pressure data can be retrieved in user selected formats from the BODC ERDDAP service.
Fluorescence

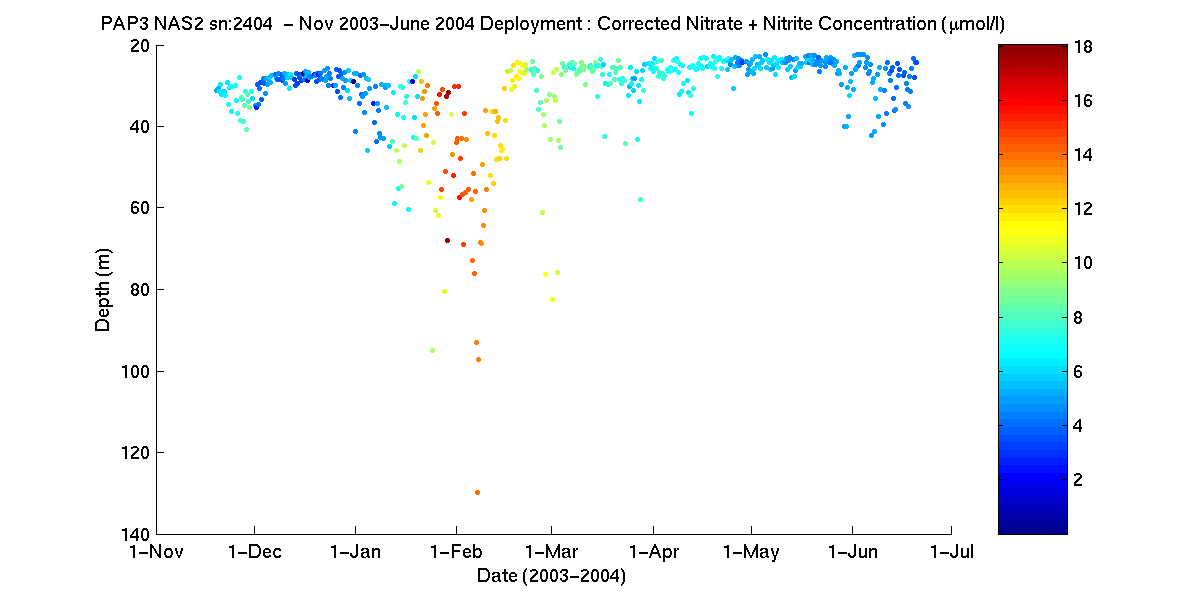
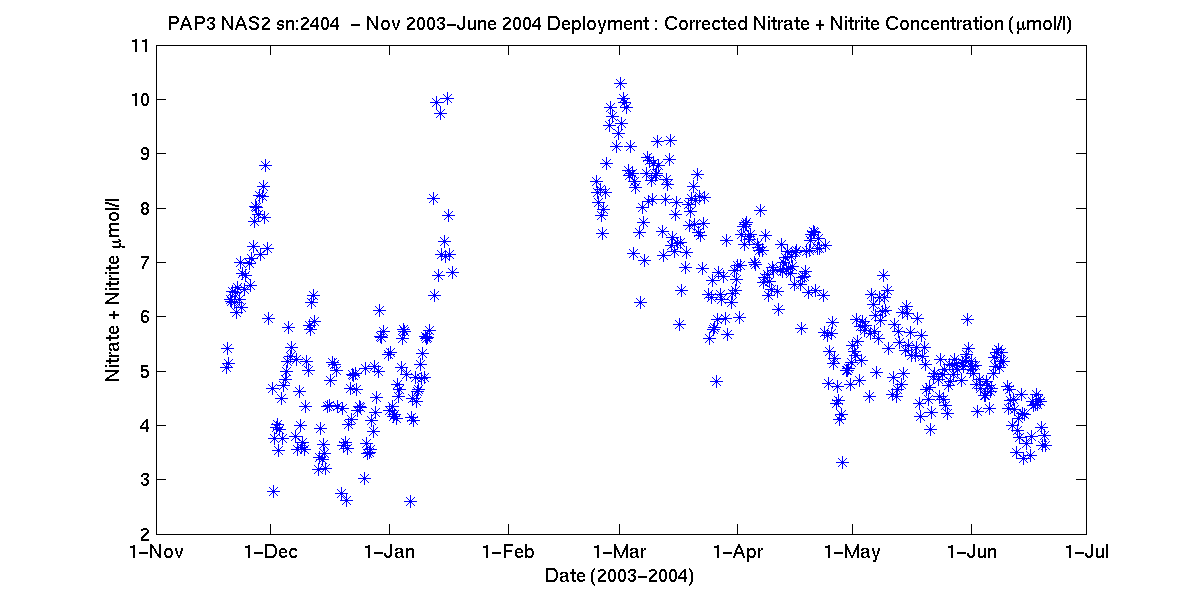
Nitrate (corrected)
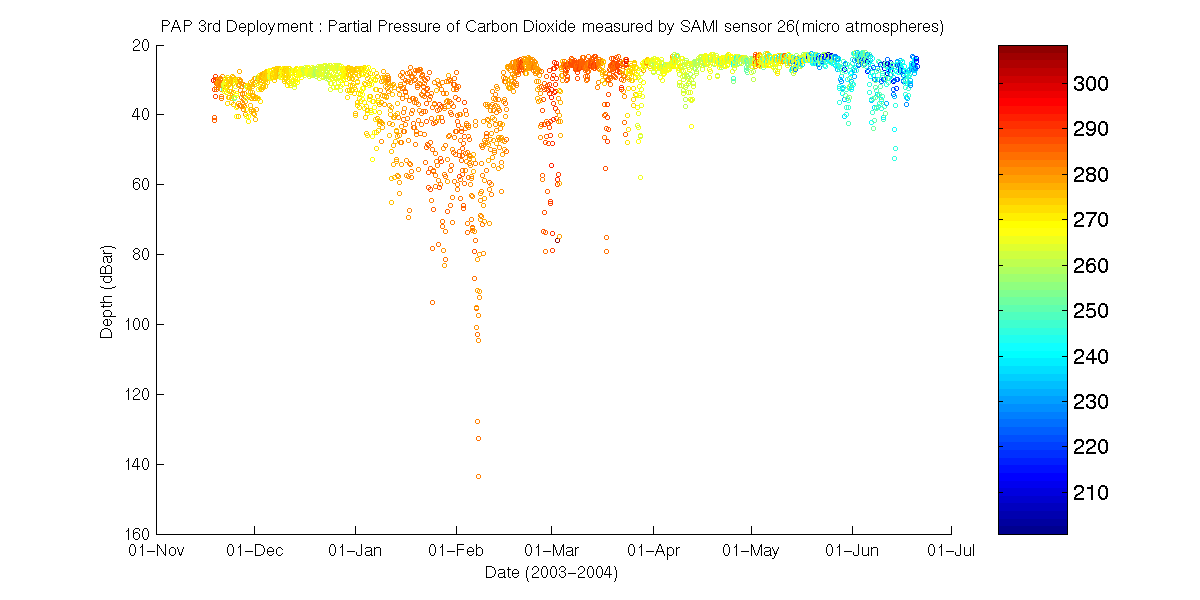
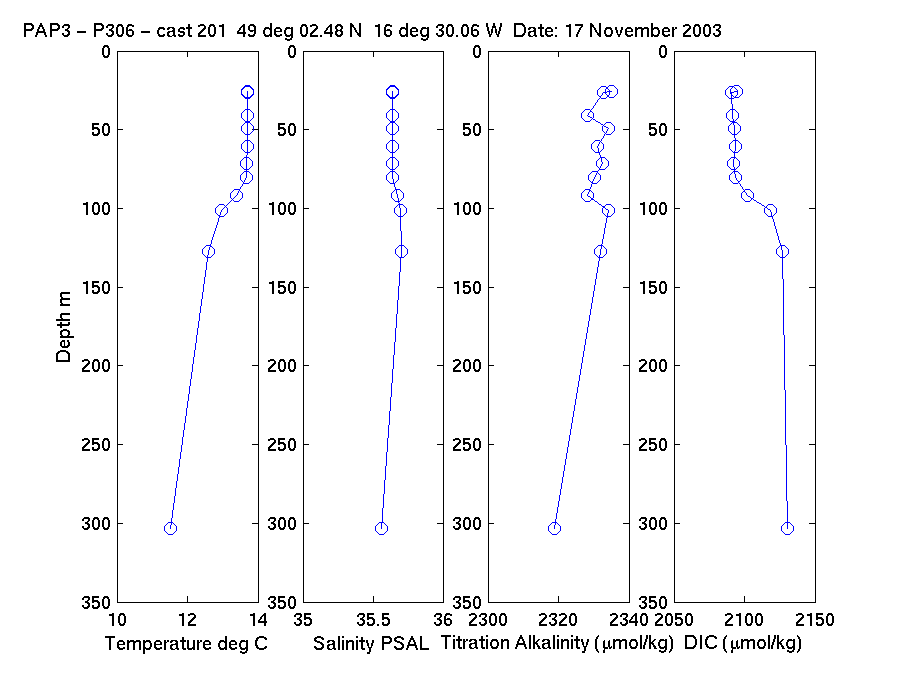
Carbon Dioxide
Nitrate Samples

Nitrate Samples (corrected)
Carbon Analysis
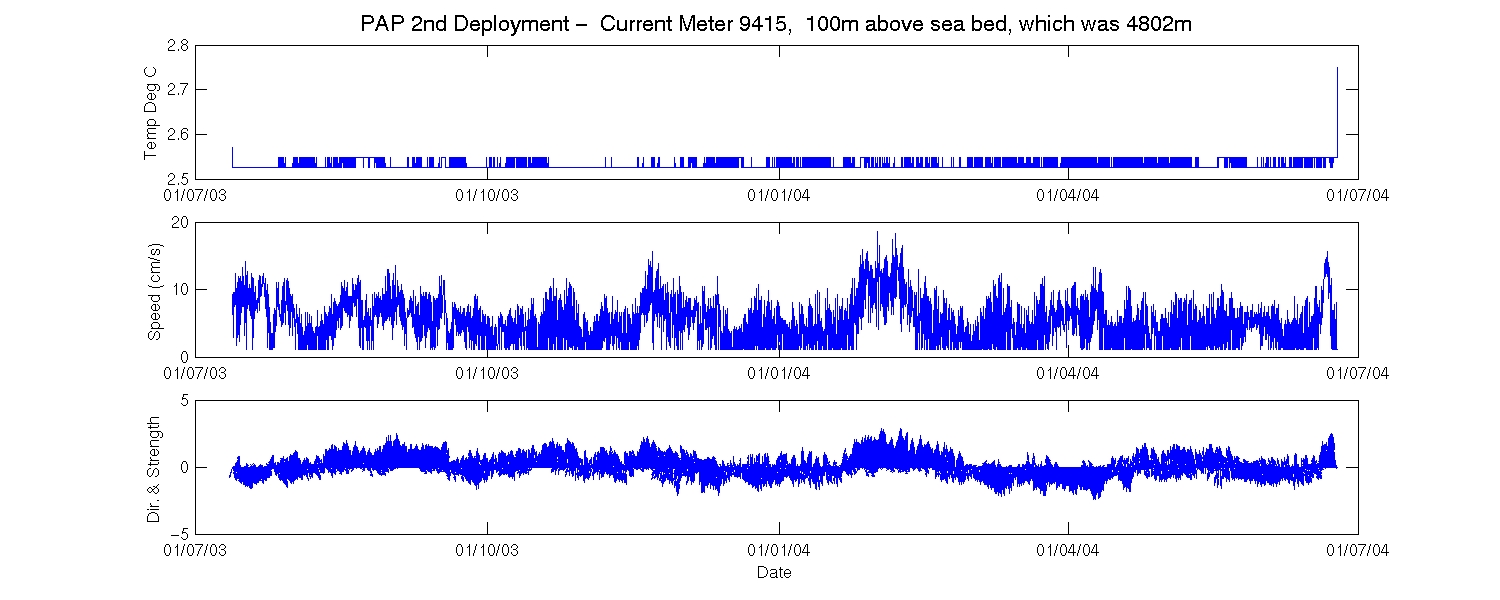
Current Meter 9415
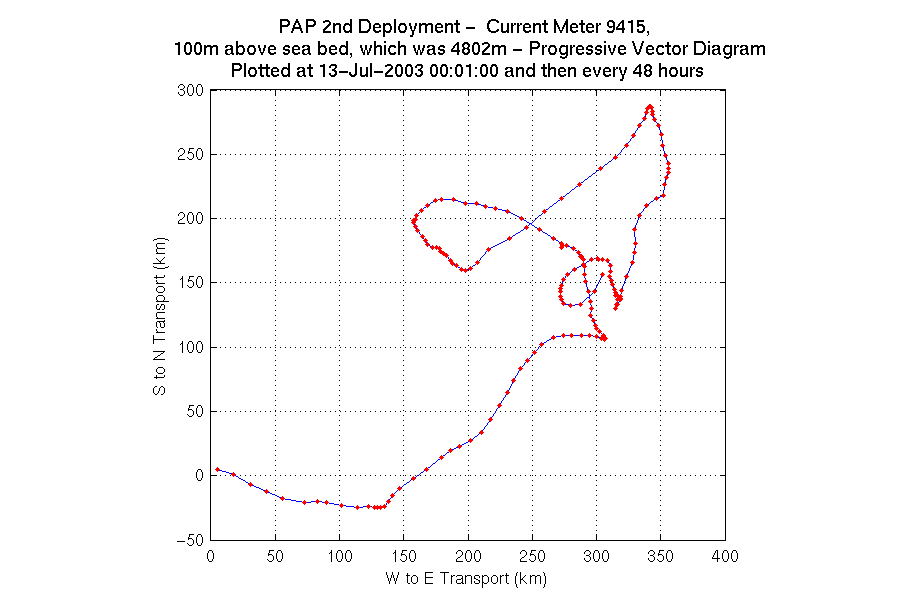
Progressive Vectors
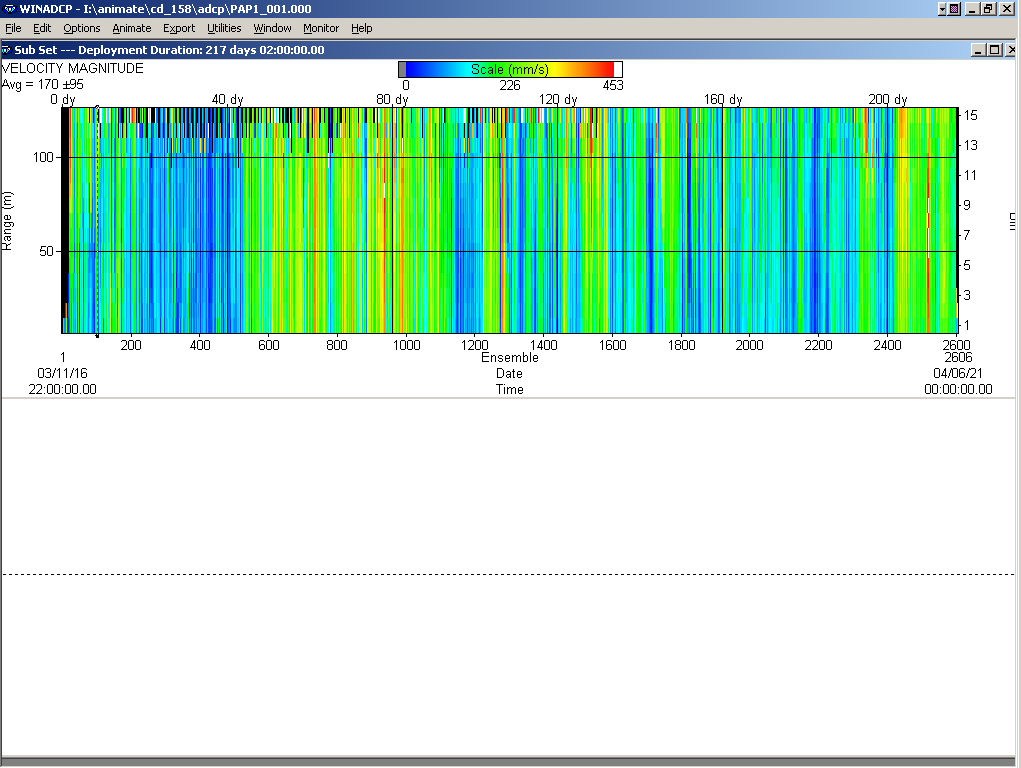
ADCP at 150m (looking up)
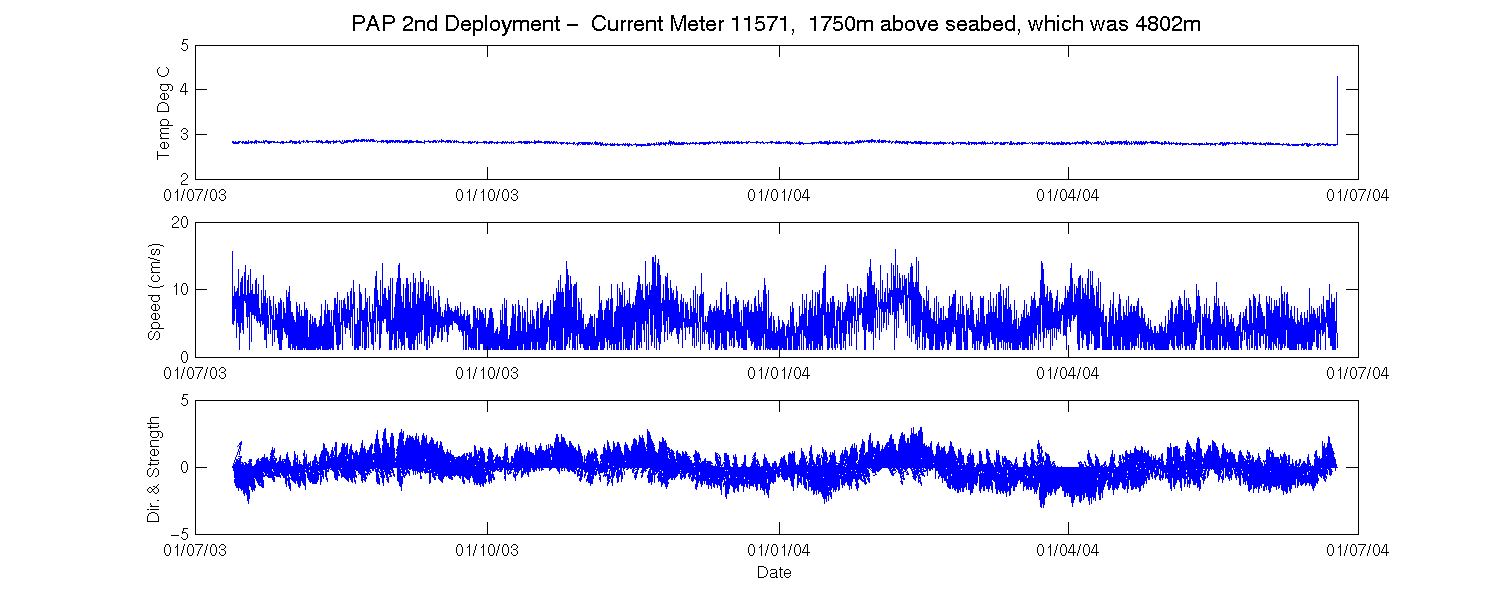
Current Meter 11571
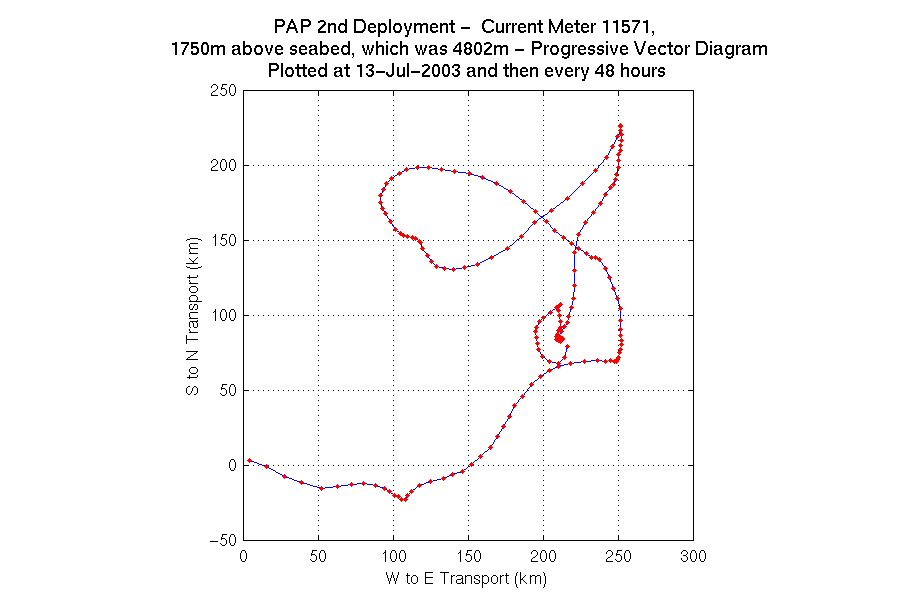
Progressive Vectors
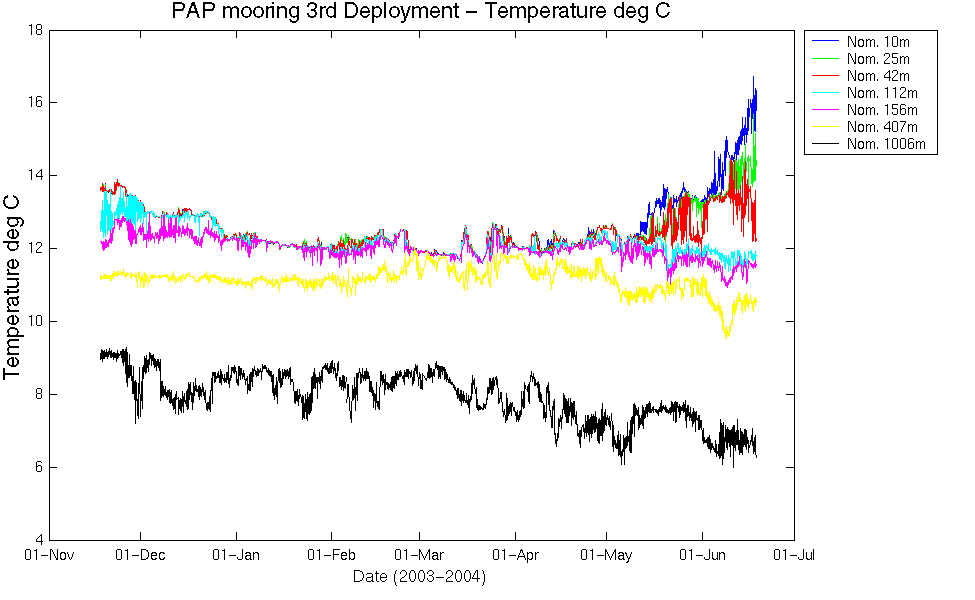
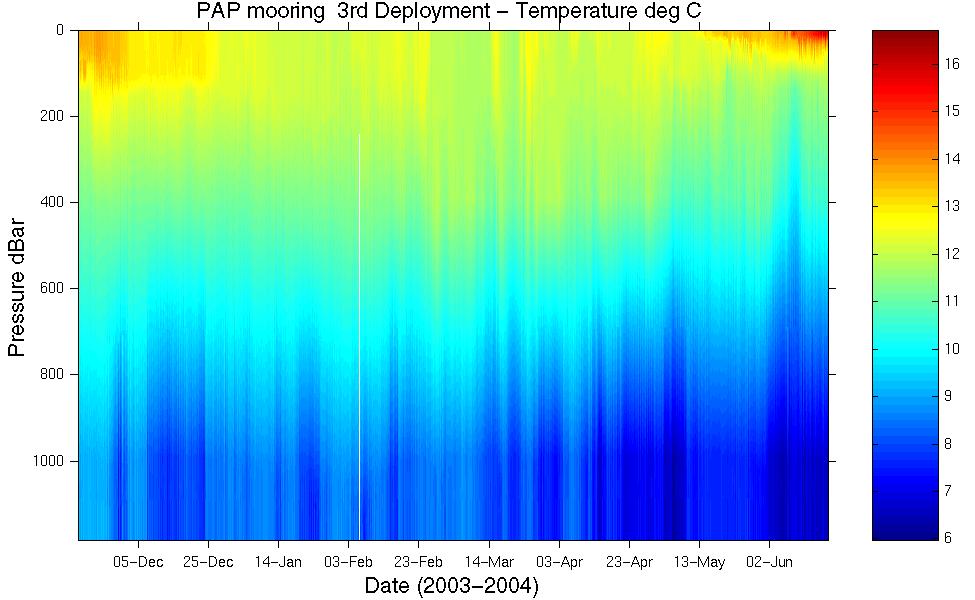
Temperature
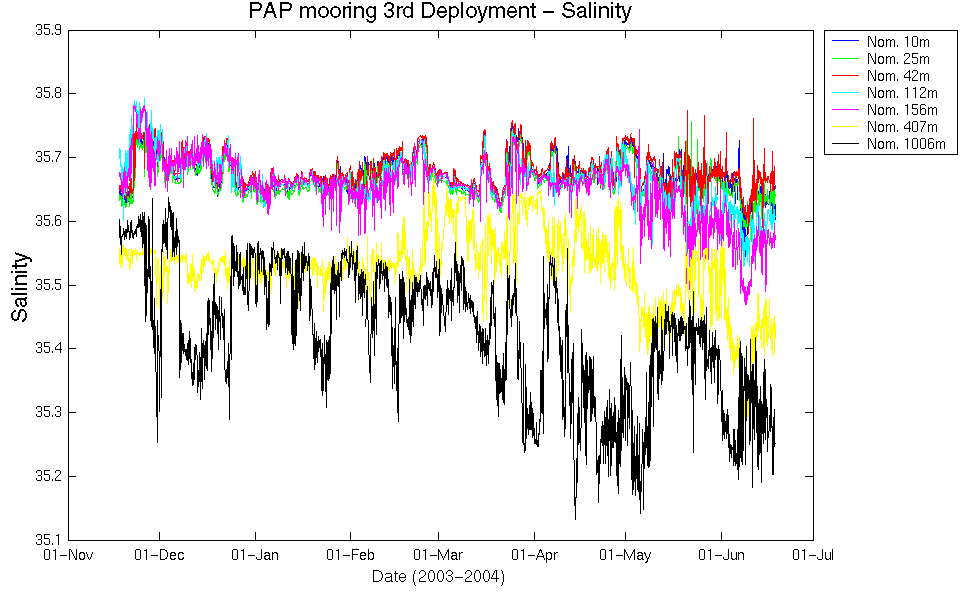
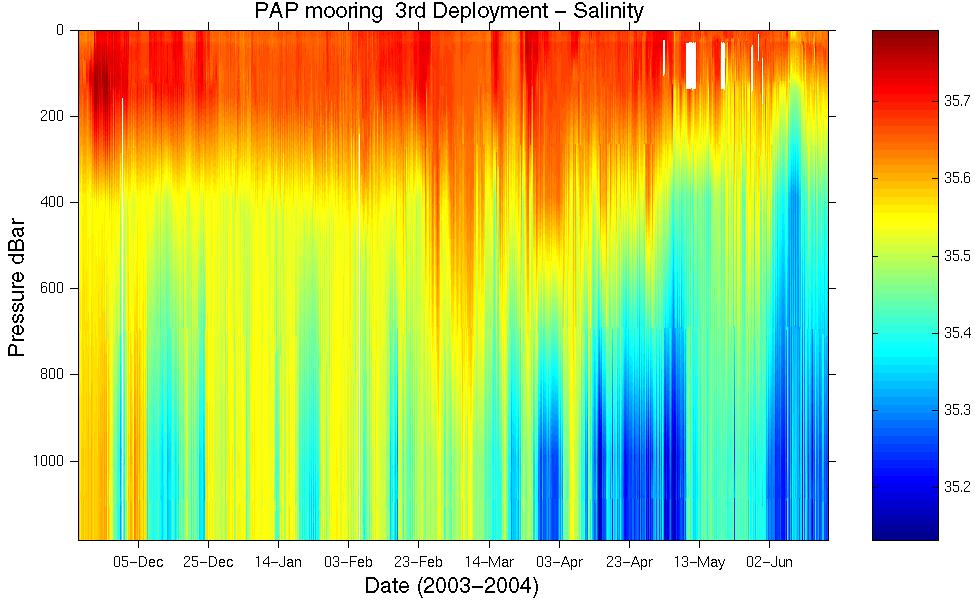
Salinity
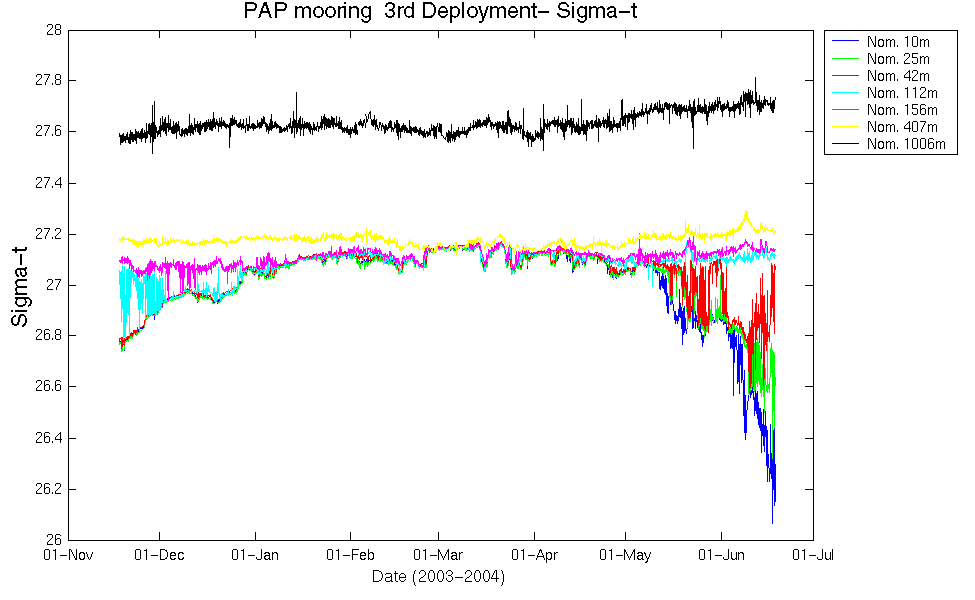
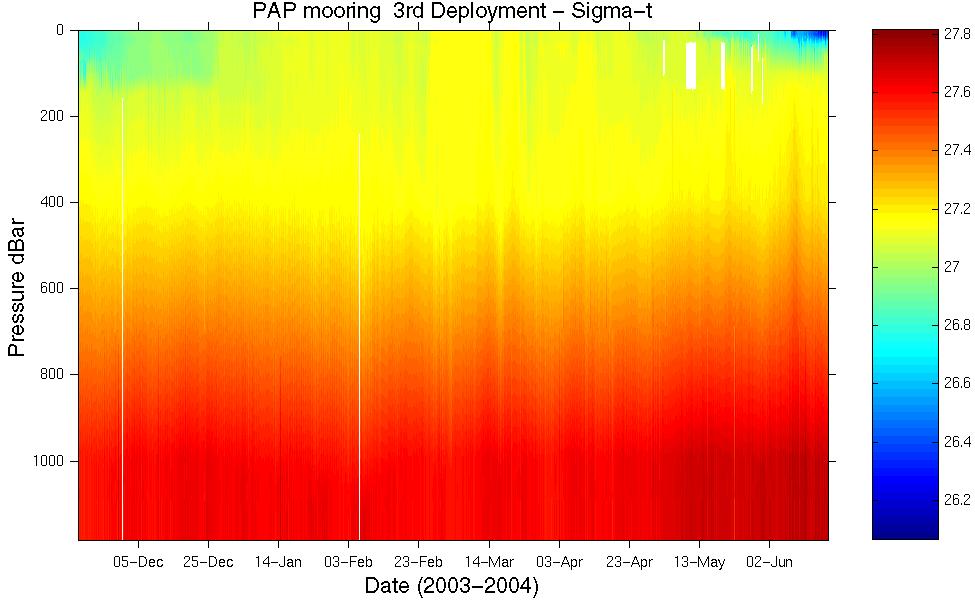
Sigma-t
Temperature Profile
Salinity Profile
Sigma-t Profile
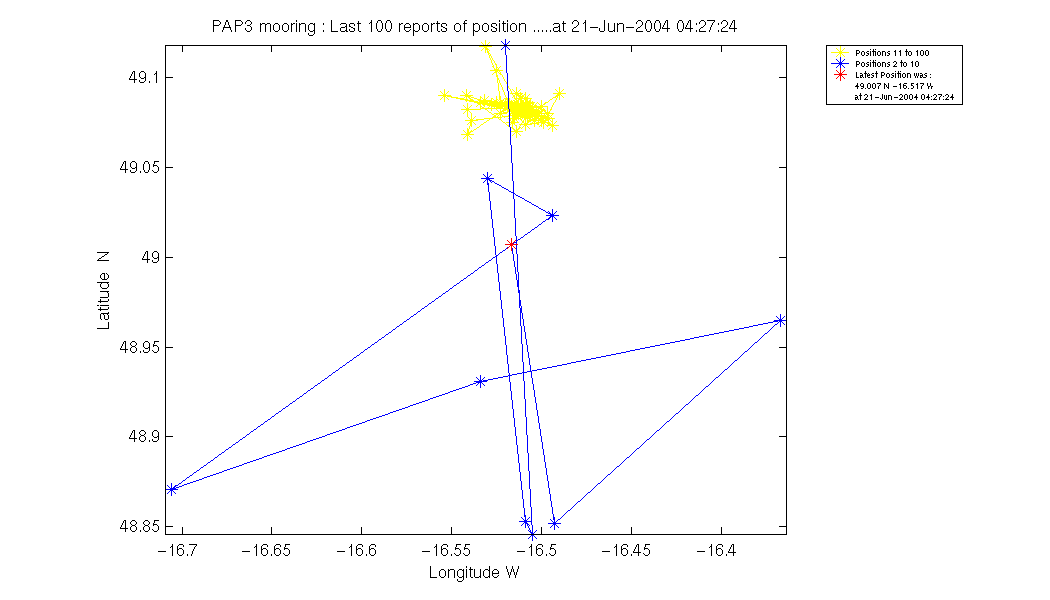
Mooring Position
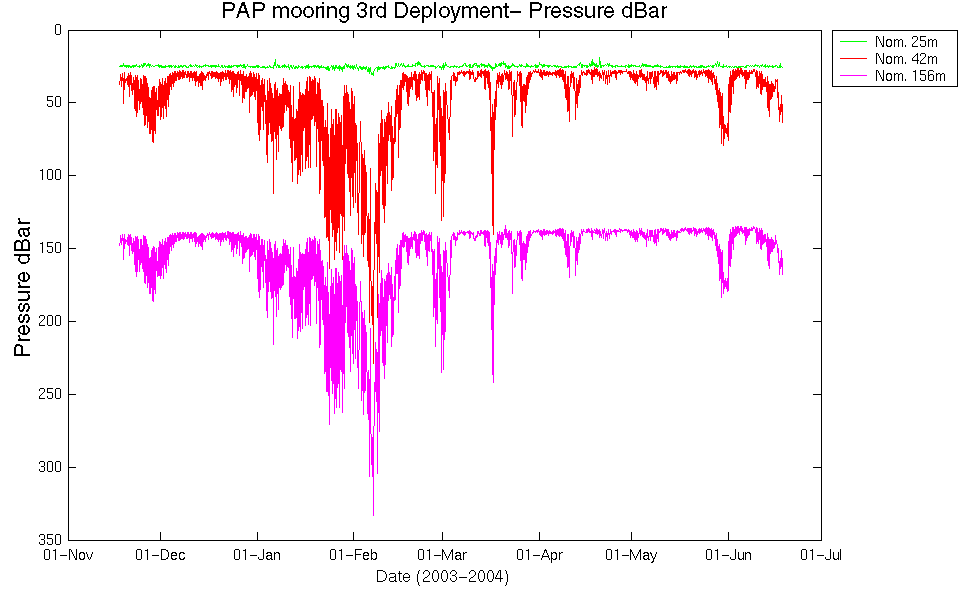
Pressure
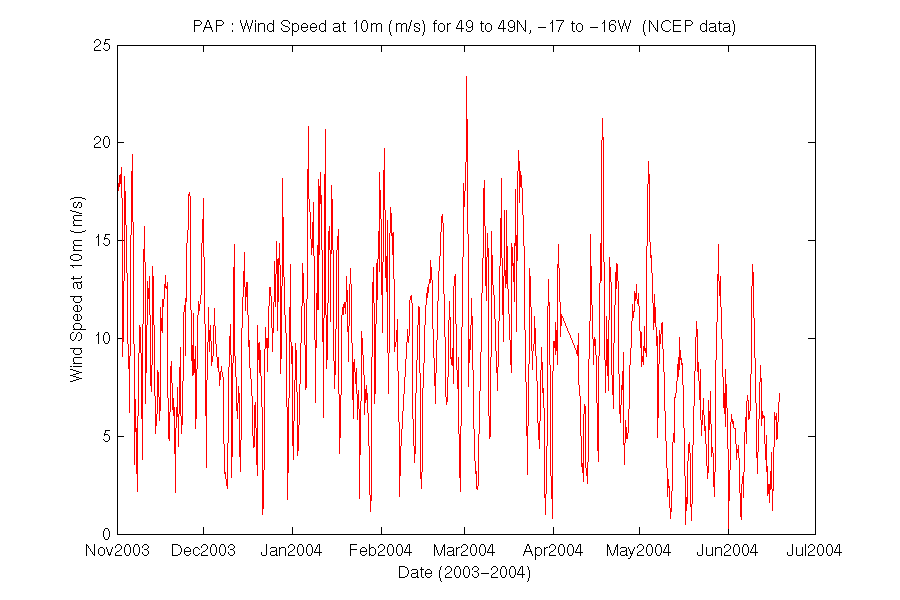
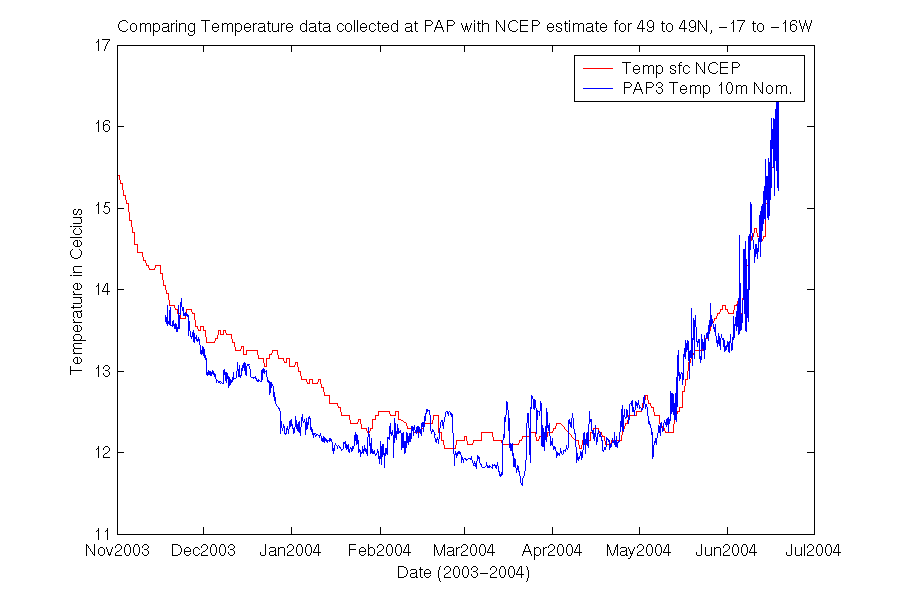
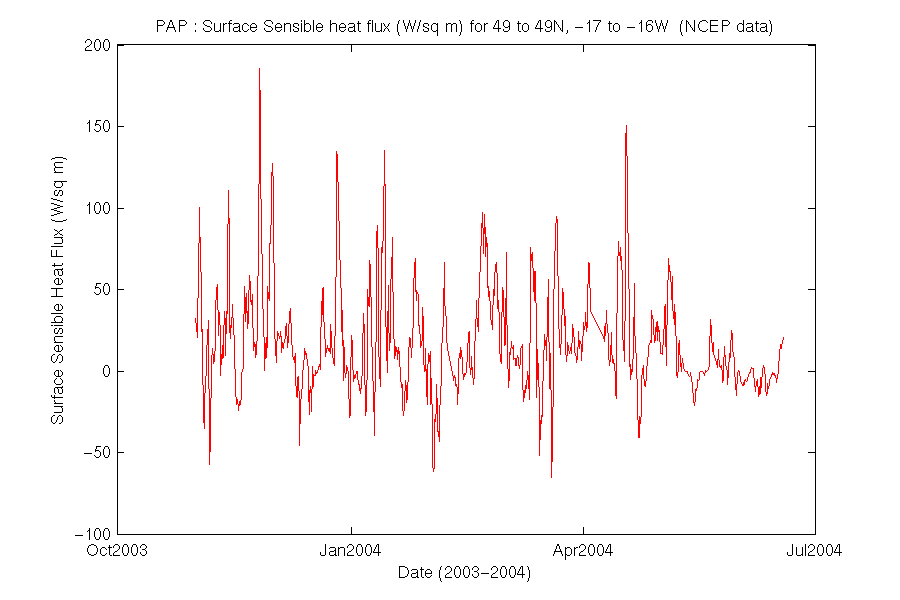
The NCEP/NCAR CDAS/Reanalysis Project makes a large amount of data available on the web, some of which are plotted here
Temperature (NCEP)
Surface Heat Flux (NCEP)
Wind at 10m (NCEP)