The June 2018 mooring was deployed on cruise JC165.
Below are the graphs generated in near-real time from data gathered at PAP and transmitted via iridium servers.
Click on an image to see a larger version.
Other data were collected at the site but were not transmitted in near-real time.
There were problems with the data from several of the Met sensors and so air temperature, humidity and wave parameters are not reported.
After recovery, data are archived at the British Oceanographic Data Centre (BODC) and can be accessed at: BODC PAP Collection. Please use the search term Porcupine or #5192 to find our data.
Click here to view engineering graphs 
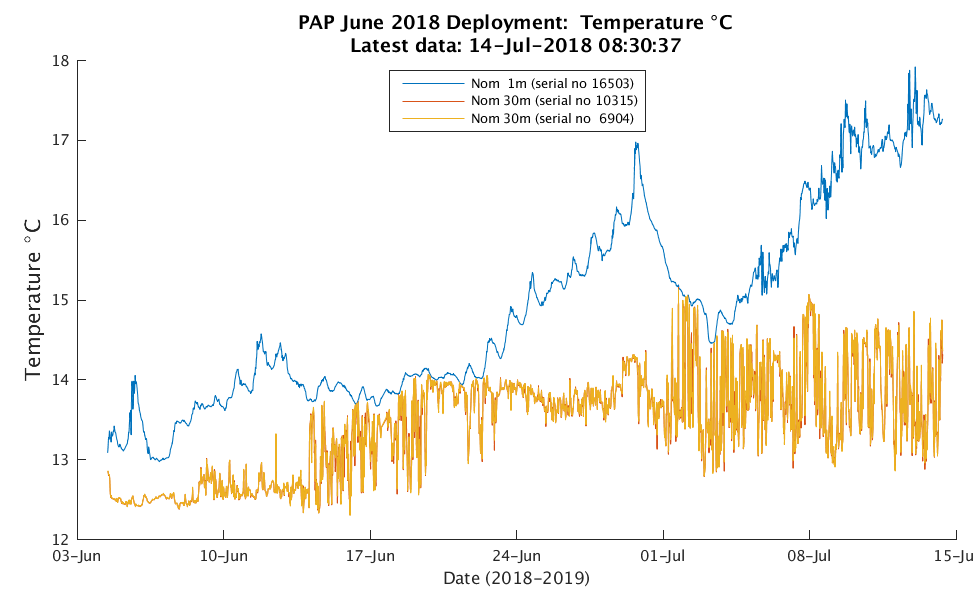
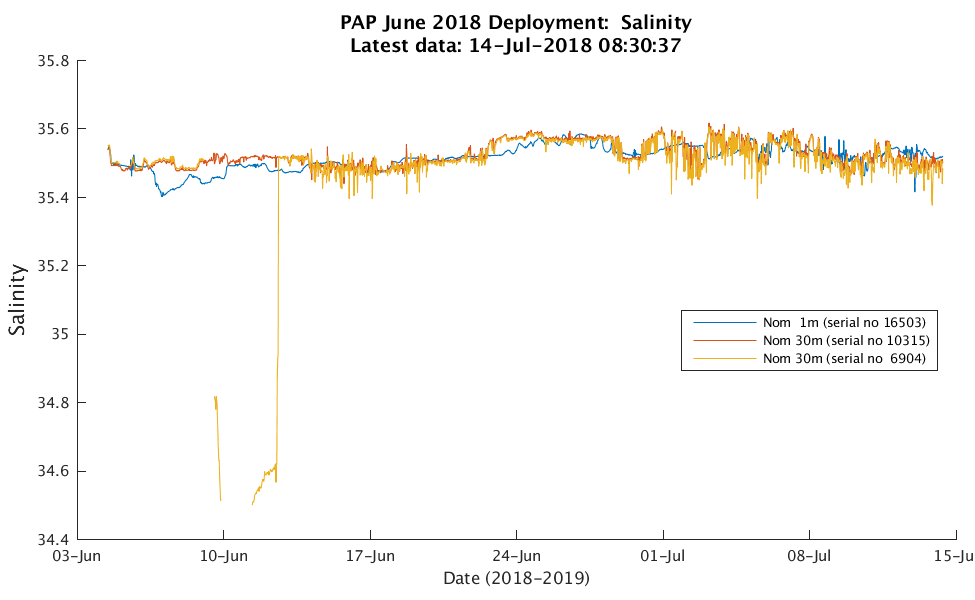
Oceanographic instruments on keel and at 30m on frame, operating in near real time
Temperature
Salinity
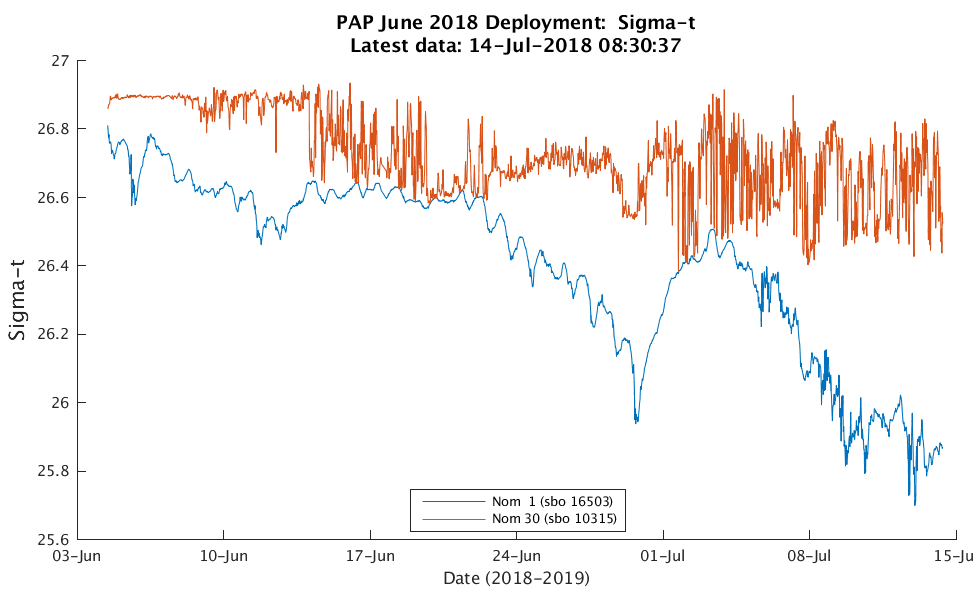
Sigma-t

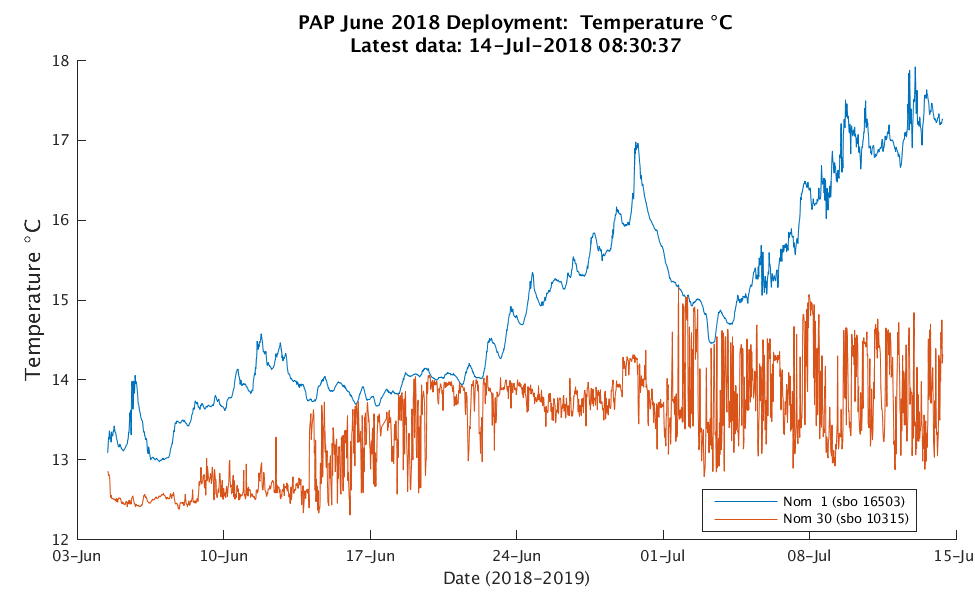
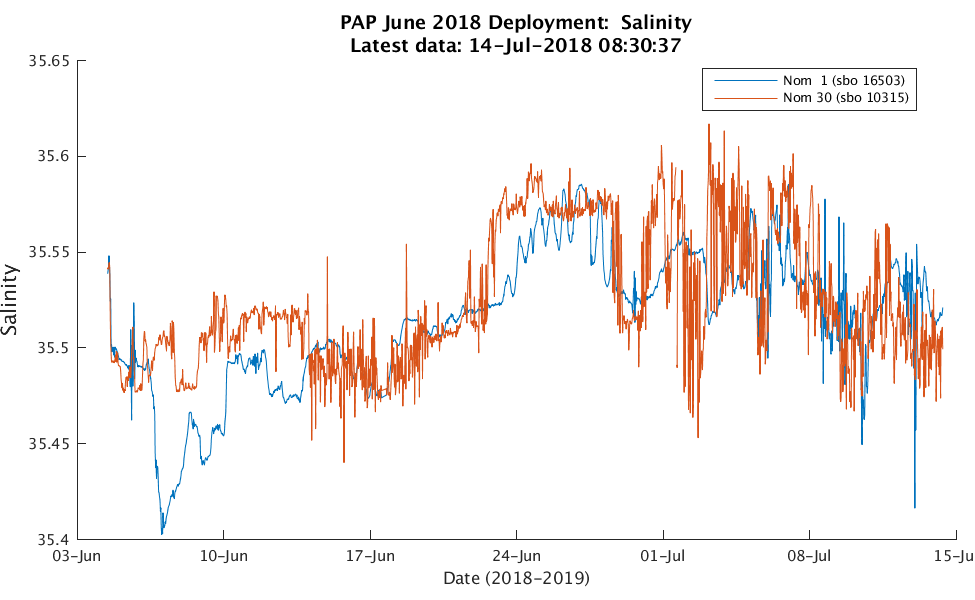
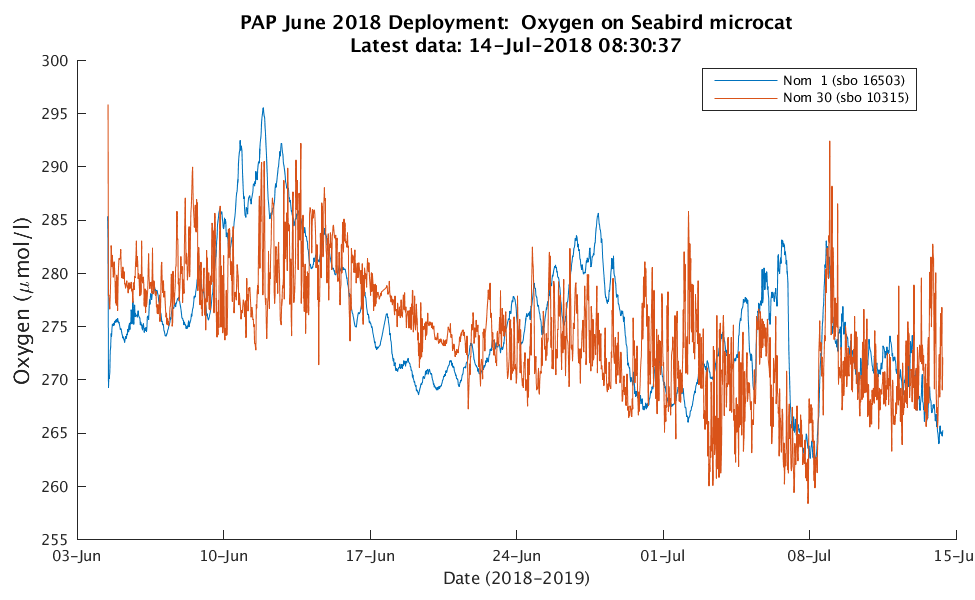
Microcats with Oxygen
Temperature
Salinity
Sigma-t
Seabird Oxygen
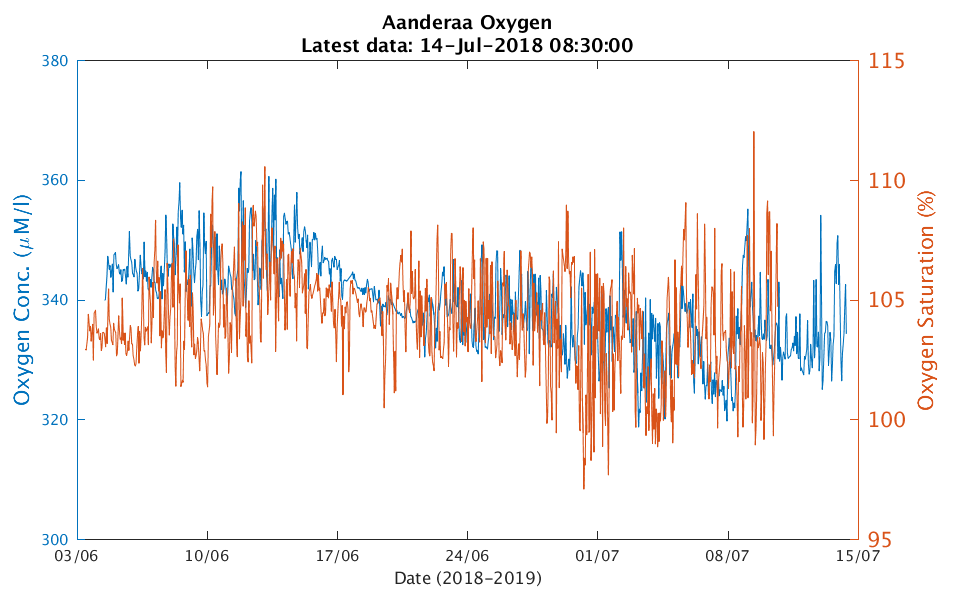
Aanderaa Oxygen
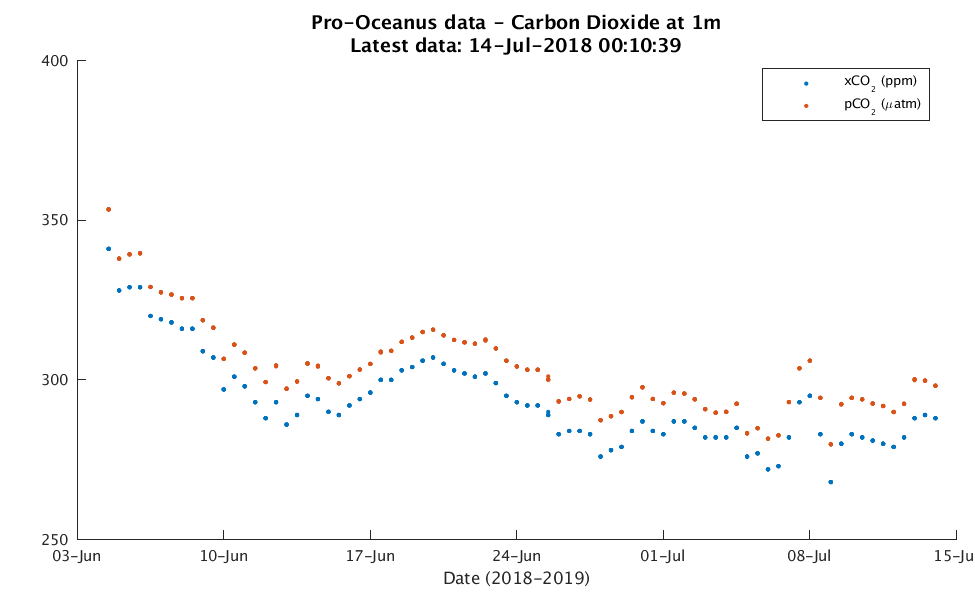
Carbon Dioxide at 1m
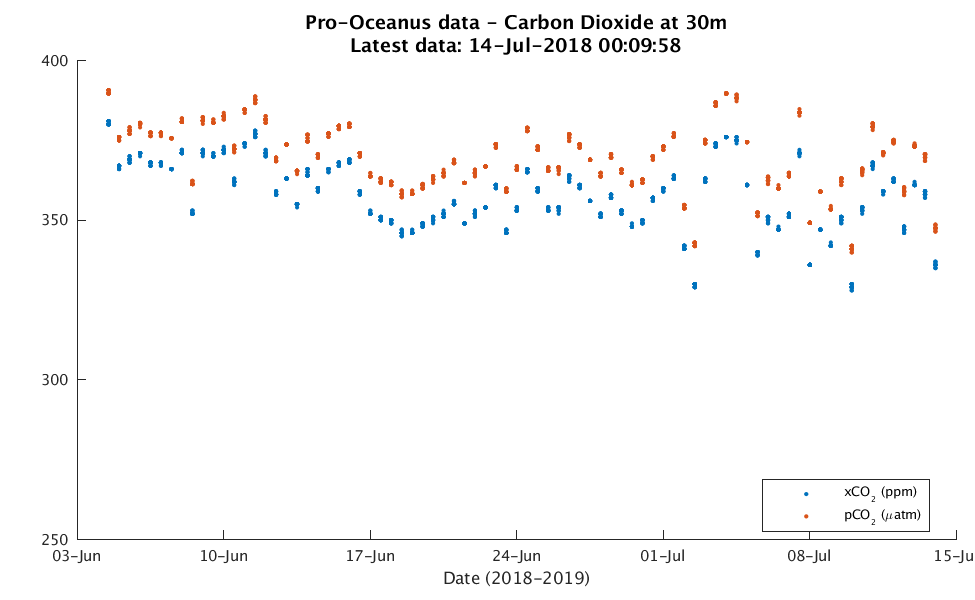
Carbon Dioxide at 30m
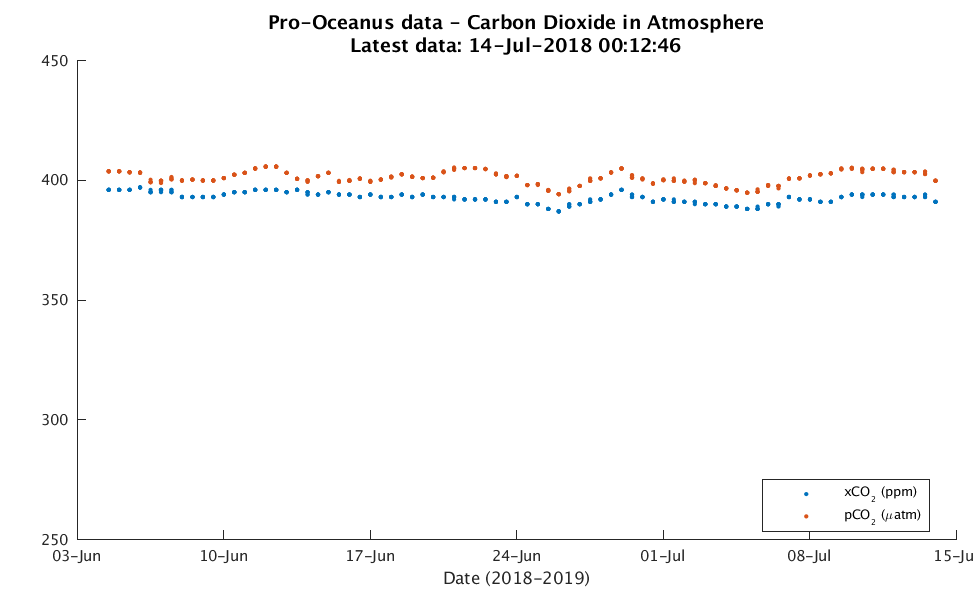
Carbon Dioxide in air
Pro-oceanus GTD-Pro at 30m

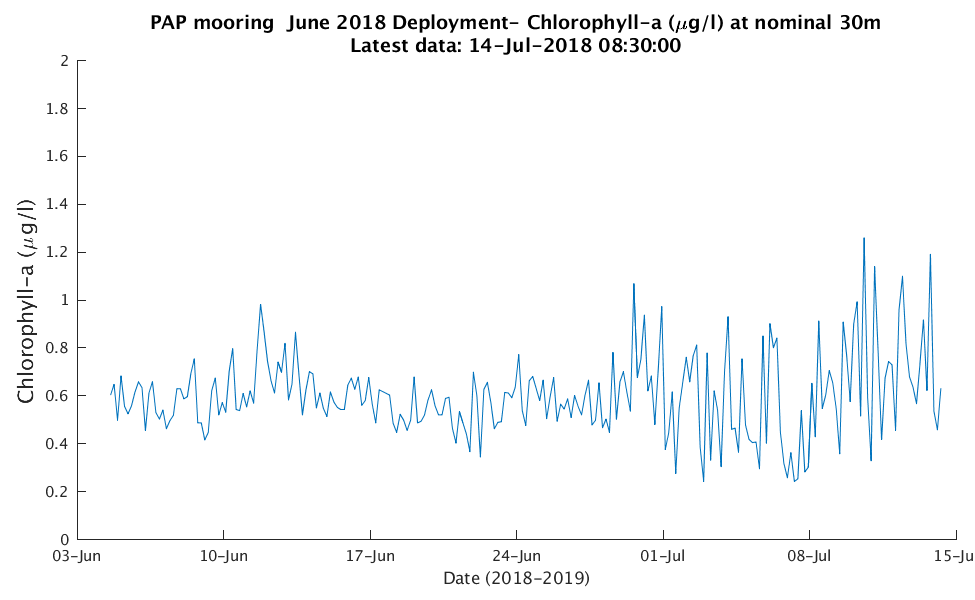
Chlorophyll-a Wetlabs
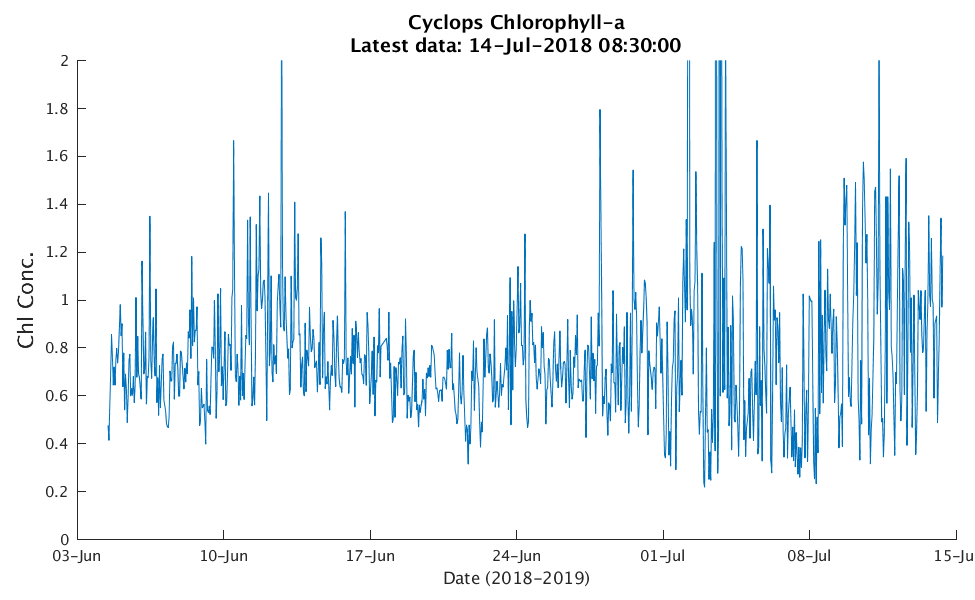
Fluorescence Cyclops
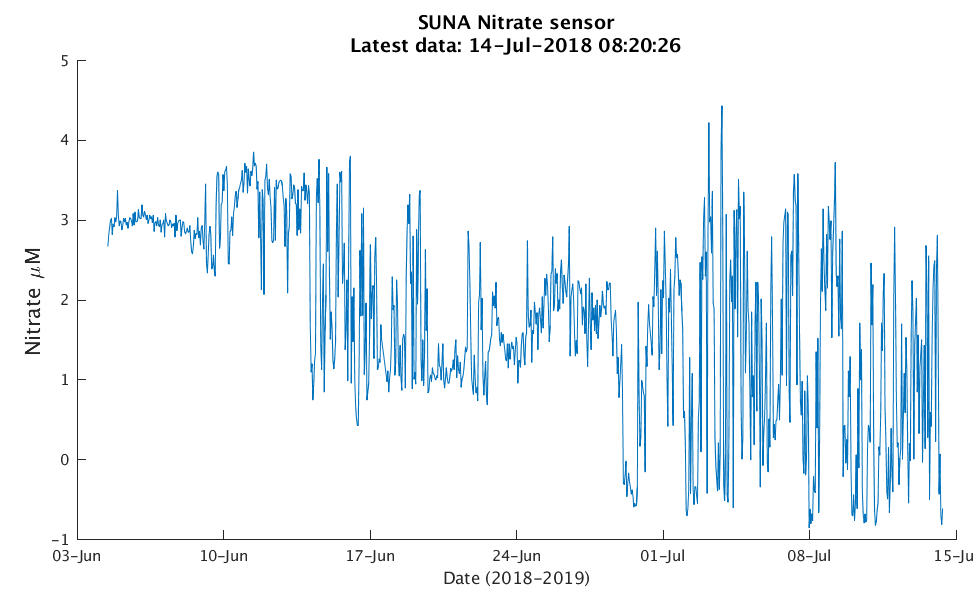
SUNA Nitrate at 30m
Satlantic pH
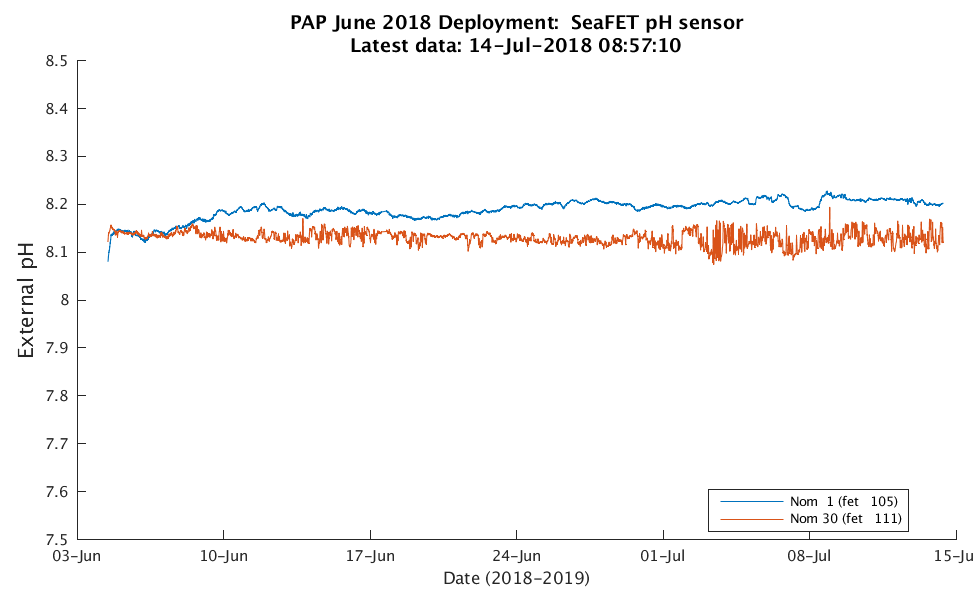
Satlantic SeaFET pH
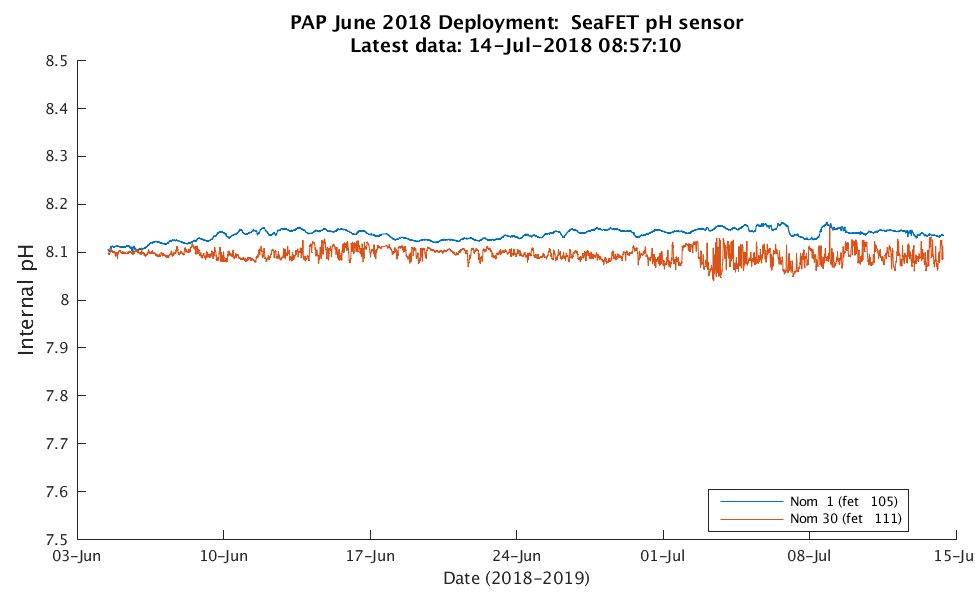
Internal pH
MetOffice UK Meteorological Data
PAP is part of the MetOffice network of weather buoys, click here to view the full network.
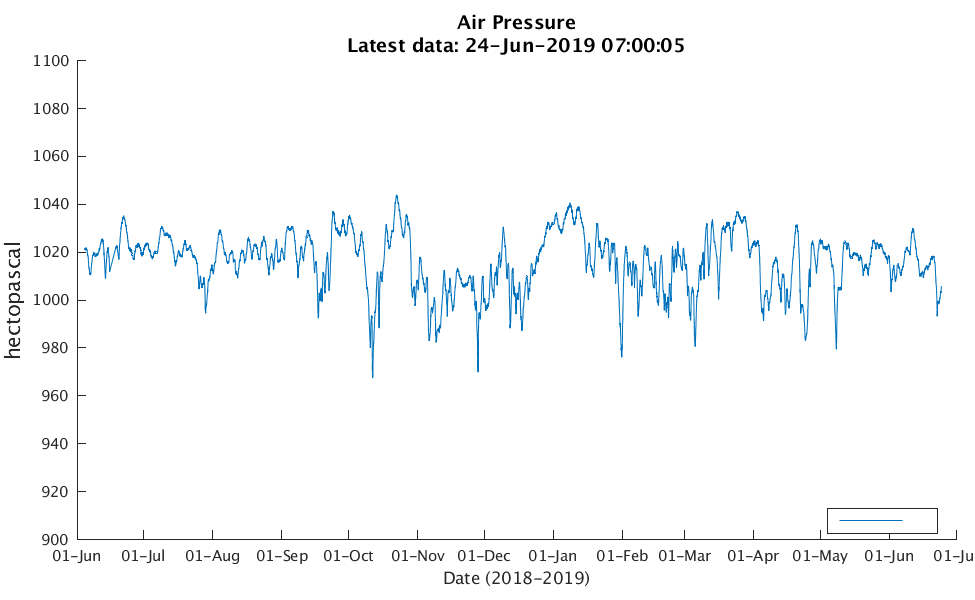
Air Pressure
Wind Speed
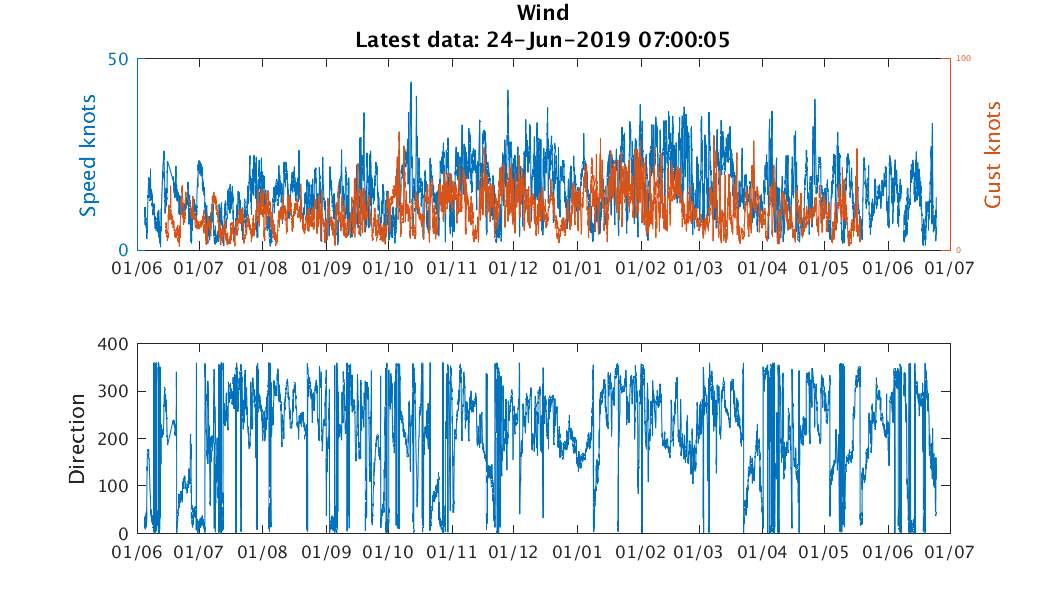
Wind Vectors
![]()
Irradiance 1
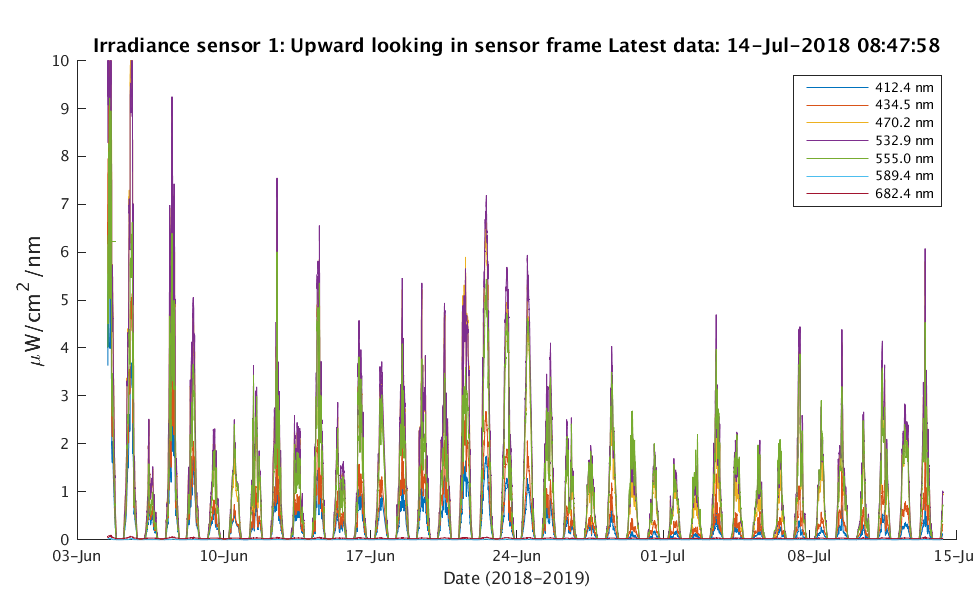
Irradiance 3

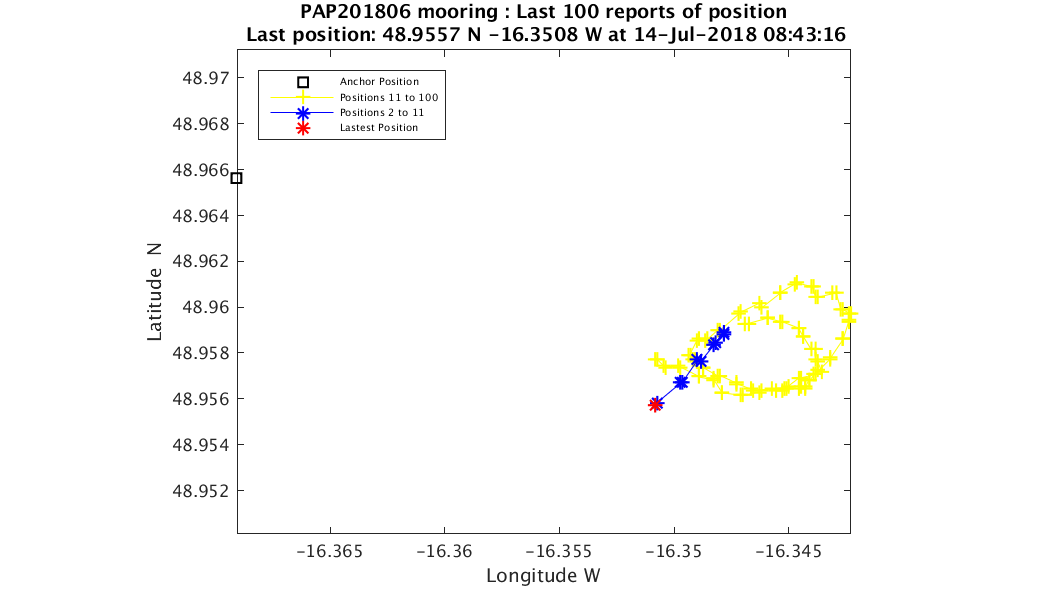
Mooring Position from Met Iridium Transmitter

Mooring Position - this cannot be updated at the moment, please refer to the Met Iridium Transmitter on the leftmost graph
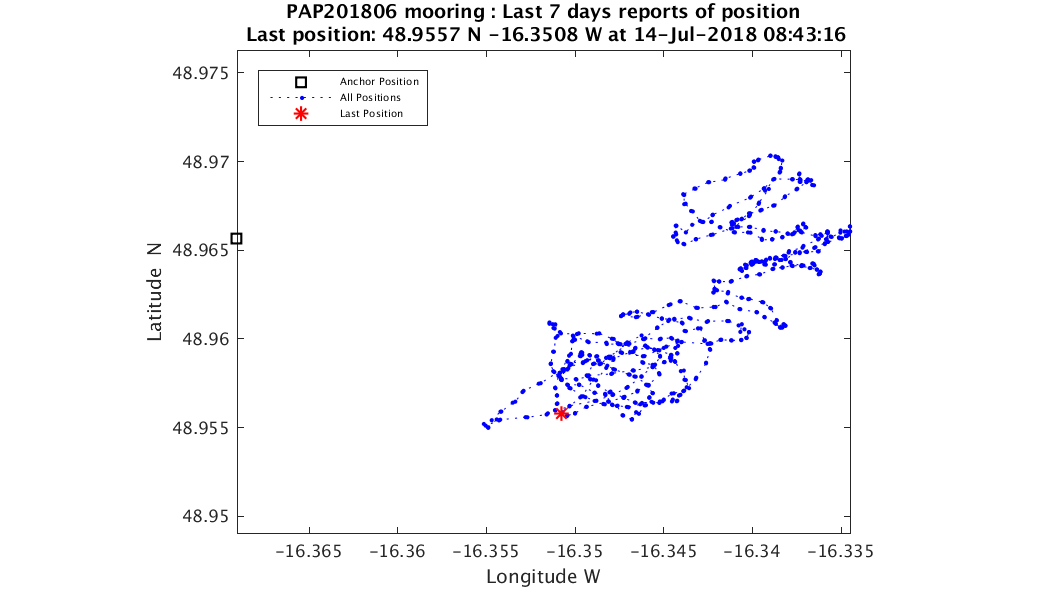
Last 7 days Track - this cannot be updated at the moment, please refer to the Met Iridium Transmitter on the leftmost graph
Seafloor (4800 m)
Seafloor samples have been taken at the PAP site for over 20 years. Many methods can only be achieved from research ships but some (time-lapse camera) is autonomous for high resolution long-term sampling.
| Method | Used for | Contact at NOCS, UK |
|---|---|---|
| Trawls | Megafauna (Species diversity, abundance and biomass | Dr David Billett |
| WASP | Wide-Angle Seabed Photography towed camera system | Dr Brian Bett |
| Cores | Boxcores, Mega- and Multicores for fauna and geochemistry | Prof. Andrew Gooday |
| Bathysnap | Time-lapse photography | Dr Brian Bett |