Nitrogen-phosphorus model worksheet
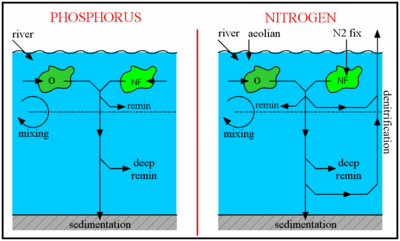
A schematic of the modelled nitrogen and phosphorus cycles. The unlabelled arrows leading into the phytoplankton (O and NF) indicate the biological uptake of nitrate and phosphate.
The aim of this nitrogen-phosphorus model worksheet is to analyse some of the properties of the nitrogen-phosphorus model, as well as helping users to become familiar with running the JModels.
Worksheet
1. Try some different types of initial conditions: e.g. (a) low nitrate (N), all else the same; (b) high N; (c) low P; (d) high P. Does the model always converge to a steady state?
2. Is it always the same steady state?
3. Try starting the model at steady state except for ten-fold less PO4 in the deep box. Try the same run in the P-only model. Is the behaviour the same in both models? In terms of surface and deep P concentrations, do the two types of model converge to the same sorts of P concentrations?
4. Run the model in steady-state and examine the fluxes. Now run the model again and examine the fluxes shortly after: (a) doubling the deep nitrate concentration, and (b) after halving it. Which fluxes have changed between the three runs? Are the changes in the right direction to restore the N:P ratio to its steady-state value? [to calculate this, use the facility to "save data" and then examine it in Excel or Matlab]
5. Try quadrupling the denitrification rate (the fraction of organic biomass that is remineralised via denitrification) in the standard model and examine the new steady-state that the model converges to. The denitrification flux should now equal ~488 Tg N y-1. Assuming other fluxes are as in the first figure overleaf, how large would the N2-fixation flux need to be in order to create a balance between inputs and outputs? Is it that size?
6. Similarly with the atmospheric input of nitrogen, what effect does a 25% reduction in AN (atmospheric nitrogen deposition) have on steady-state fluxes?
7. From the steady-state, try increasing RP (river delivery of phosphate) by 25%. What effect does this have on TPP? Reset the model parameters to their default values, run to steady-state again, then try increasing RN (river delivery of nitrate) by 25%. What effect does this have on TPP?
8. Look at the figures from the increased RN run. Why does increasing RP have an effect on TPP, but increasing RN have none? How is this possible when surface nitrate is more limiting to the ‘other’ phytoplankton?
9. Can you explain how/why it is possible to have distinct proximate and ultimate limiting nutrients?
Once you have completed these questions, follow this link for the answers.
Tyrrell, T. (1999). The relative influences of nitrogen and phosphorus on oceanic primary production. Nature 400, 525–531.