Phosphorus model help
The Phosphorus Model Help is a help page describing the interface through which simulations of the phosphorus model can be set up and controlled. This article describes each of the communications windows that the GUI uses. All of the other nutrient models are controlled in the same way as the phosphorus model, so the information in this article applies to these models too.
Main page
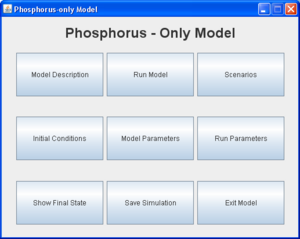
The main page shows a series of labelled buttons. These either give access to other pages for controlling the phosphorus model (e.g. initial conditions), or perform a particular action (e.g. run model). To select a button, press the left mouse button.
Model description
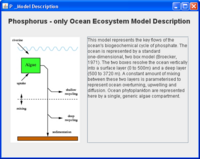
This page shows a diagram of the model and gives a simplified description of the modelled components and the fluxes between them. A much more complete description of the model is given in the documentation (e.g. here for the phosphorus model).
Run model
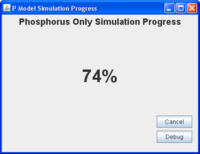
This button sets the model running using the initial conditions, parameter values and scenario selected by the user. During the simulation a progress window is shown to tell the user how far through the run the simulation is. For simple simulations this window may only briefly appear, but for more complex or long simulations, such as the scenario runs, this window helps you know that that the model run is still progressing.
Scenarios
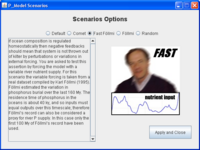
This page allows the user to select one of the pre-programmed scenario simulations. The default setting is for no scenario to be used, and for the model to proceed uninterrupted using selected initial conditions and selected parameter values.
The Comet scenario simulates an idealised cometary impact event on the Earth. After a short initial period (50 ky) during which nothing happens, a comet impacts the Earth. This is assumed to produce a massive dust cloud which blocks sunlight, leading to decreased global temperatures and insufficient light for photosynthesis. For this reason, and because new species may also need time to evolve following the associated mass extinction, phytoplankton are unable to grow in the model during the period following the impact. This period lasts a further 50 ky, after which the dust in the atmosphere has settled out and sunlight can again reach the Earth's surface. The scenario then continues for a further 200 ky so that the recovery of the Earth can be studied. More information can be found in the comet impact article.
The Follmi scenarios force the model with time-varying riverine phosphate inputs to the ocean. In the default case, riverine input is constant, but these scenarios use a 10 million year time-series of inputs inferred from the sedimentary record. The model's dynamic response to these variations is of interest in these scenarios, especially where other nutrients (nitrogen, silicon) are considered. The "Fast Follmi" scenario accelerates the riverine input time-series such that it occurs within 1 million years.
The Random scenarios function as teaching tools. They require the user to enter a number between 0 and 9 (normally the final digit on a student ID card). This selects one of 10 distinct scenarios of model change. Based on experience gained from using the model, the challenge is to use the model output (plots and saved data) to work out what changes took place in the scenario.
Note that changes made to model initial conditions or parameters are retained even when a scenario is selected.
Initial conditions
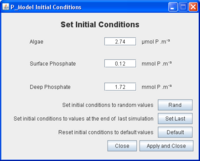
This page shows the initial conditions for each of the model's state variables. The values of these variables can be changed by the user. The Rand button uses a randomising function to set the parameters to random values. The Set Last button sets the initial conditions to the values of the state variables at the end of the last simulation. This is useful should a user wish to continue a run. Multi-stage runs can potentially be generated in this way. The Default button returns the initial conditions to their default values.
Model parameters
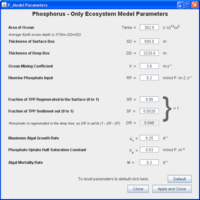
This page shows the values of each of the model's parameters. These can be changed by the user. The Default button returns the parameters to their default values. Note that the values of some parameters cannot fall outside certain ranges, and that the GUI will show a warning and not accept such values. Note also that the parameters SR, DR and SF are necessarily tied together, and that changing either SR or SF will result in the value of DR being changed.
Run parameters
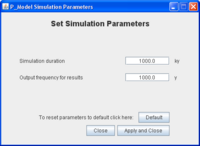
This page shows the values of two parameters. The first, Simulation duration, is the period (in thousands of years) that the model will run for. Typically, simulations of 200 thousand years (= 200 ky) are sufficient for the model to reach equilibrium. The second, Output frequency, is the frequency at which data is saved after a run is complete. Typically, a frequency of between 100 and 1000 years is sufficient to understand model behaviour. The smaller this number, the larger the output file that will be produced when data is saved.
Model results
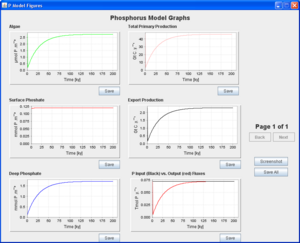
When a model simulation is complete this window appears to show the time evolution of the model state variables and fluxes. The panels of this window can be saved individually, saved together or a screenshot of the window can be taken. If this window is closed accidentally, it can be reopened from the show final state page.
Show final state
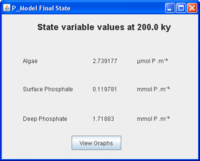
This page shows the final values of the model's state variables at the end of the simulated period. This page also allows the user to re-spawn the results window.
Save simulation
When the save simulation button is pressed, a save file window is spawned that allows the user to select the location and filename in which to save the last simulation's data. The default filename increments with each saved dataset, so saving subsequent runs should not overwrite previous runs.
Exit model
This button terminates the GUI.
Further information
Phosphorus model overview
Phosphorus model details
Phosphorus model model cons
Phosphorus model pros
Phosphorus model help
Phosphorus model worksheet

