Phosphorus model worksheet
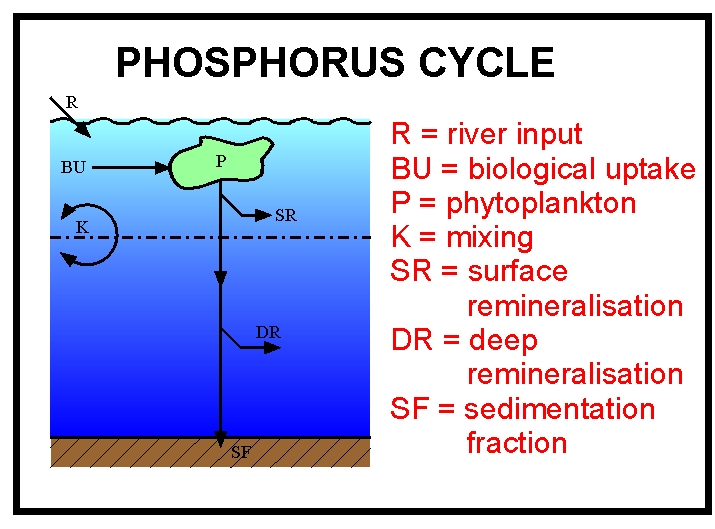
A schematic of the model phosphorus cycle
The aim of this phosphorus model worksheet is to analyse some of the properties of the phosphorus model, as well as helping users to become familiar with running the JModels.
Worksheet
1. Try some different types of initial conditions: e.g. (a) halved deep phosphate, all else the same; (b) doubled deep P, all else the same; (c) ten-fold higher surface phytoplankton, surface and deep P the same. Does the model converge to a stable equilibrium (= control phosphorus) in each case? [remember to reset initial conditions before making each change, so previous changes are wiped clear]
2. Is the final state always the same?
3. The return to the equilibrium state is governed by the balance between inputs and outputs. Examine the size of the burial flux: (a) immediately after doubling of deep phosphate, all else the same; and (b) after halving of deep phosphate. Does the behaviour of the burial flux in these situations help the model return to equilibrium?
4. Try adding 1.0 mmol PO4 m-3 to: (a) the surface box, and (b) the deep box. Which has the greater effect on phytoplankton concentrations over the next few thousand years? Why?
5. What impact does the extra phosphate have on the biology? What impact does the induced biological change have on the extra phosphate?
6. Reset to the default initial conditions and then examine the effects of altering RP, the river supply of phosphate. What are the effects on phytoplankton concentrations and total primary production (TPP) of: (a) doubling RP, and (b) halving RP?
7. How do the steady-state surface phosphate concentrations compare, between the two runs? How can you square this with the effects on the biology?
8. Using the default value of RP, now try altering the value of K (intensity of ocean mixing/overturning) by doubling its value. Wally Broecker & Tsung-Hung Peng (Tracers in the Sea) calculated in 1982 (no computer models back then) that this change in K should lead to the deep box phosphate concentration beginning a long, slow decline towards a new, lower steady-state value. They calculated (their figure 6.2) that it should take about 35,000 years for half of the change to be brought about. Do you agree? [to calculate this, use the facility to "save data" and then examine it in Excel or Matlab]
Once you have completed these questions, follow this link for the answers.
Refrences:
Broecker, W.S. & Peng, T.H. (1982) Tracers in the Sea, Eldigio Press, pp. 275-2