Nitrogen-phosphorus model details
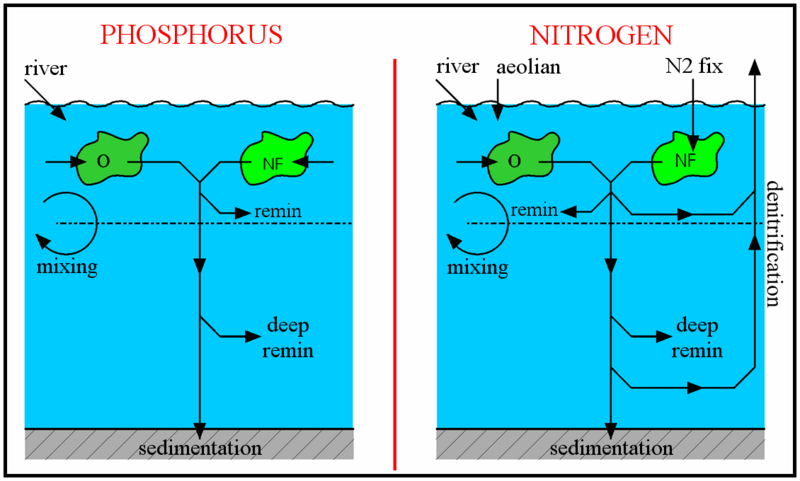
A schematic of the modelled nitrogen and phosphorus cycles. The unlabelled arrows leading into the phytoplankton (O and NF) indicate the biological uptake of nitrate and phosphate
This article provides information on nitrogen-phosphorus model details, including the ordinary differential equations and parameters that describe the model. As with the other two nutrient models, the aim of this model is to strip away much of the complexity of the real ocean and its component ecosystems in order to focus on the key processes that regulate nitrate concentrations in the ocean.
Overview
The schematic to the right shows how the oceanic cycles of nitrogen and phosphorus are represented in the model. The model is a standard one-dimensional, two-box model of the global ocean, with the top layer representing the surface ocean down to the limit of the deepest wind-induced mixing during the year (down to the annual thermocline) and the bottom layer representing the deep ocean.
There is a simple representation of the physical processes that transfer nitrogen and phosphorus vertically in the ocean. This occurs in reality partly through mixing between the surface and deep oceans, partly through the physical movement of large masses of water between the surface and deep layers (upwelling and downwelling; ocean circulation), and partly due to diffusion. These physical processes are simulated by exchanging a slab of water between the surface and deep boxes. The rate of exchange equates to swapping a slab of thickness 3 metres between the two layers every year (according to the standard value of the parameter K).
The marine phosphorus cycle
The largest fluxes of phosphorus are included in the model. Phosphorus is almost totally absent from the atmosphere, and the only significant input of phosphorus to the oceans comes via river water. The most significant output of phosphorus from the oceans is in organic debris sinking to the ocean floor and becoming incorporated into sedimentary rocks. As well as these input and output fluxes of the ocean as a whole, the model also includes the most important processes redistributing phosphorus within the oceans, as follows:
1. Uptake of dissolved phosphate into phytoplankton biomass;
2. Subsequent release (through grazing, cell lysis, bacterial degradation, and so on) of most of this phosphorus back into dissolved nutrients in the surface ocean;
3. Release of a further portion of the organic phosphorus back into deeper waters after organic material has sunk out of the surface oceans; and
4. Slow mixing between the surface and deep oceans, partly due to the physical movement of large masses of water between the surface and deep layers (upwelling and downwelling, ocean circulation), and partly due to diffusion. These physical processes are simulated by exchanging between the surface and deep boxes a slab of water of a given thickness (3 metres, according to the standard value of the parameter K) every year.
The marine nitrogen cycle
This is more complex than the phosphorus cycle. For instance, nitrogen occurs in seawater in several dissolved forms. This is in contrast to phosphorus, which primarily occurs as phosphate. The different bioavailable nitrogen forms include nitrate ([NO3-], typically present at 0-40 μmol N kg-1), nitrite ([NO2-], 0-1 μmol N kg-1) and ammonium ([NH4+], 0-1 μmol N kg-1). Reactive nitrogen is the only form of nitrogen explicitly included in this model, and refers to the sum of the forms of nitrogen easily taken up by phytoplankton, i.e. ([NO3-] + [NO2-] + [NH4+]). Other, less bioavailable, forms of nitrogen are dinitrogen (N2, ~1000 μmol N kg-1) and dissolved organic nitrogen (DON) compounds, with the latter generally unavailable to phytoplankton. The concentration of N2 (which requires greater energy expenditure to access, due to its strong triple bond between the two N atoms) is not explicitly included in the model because it is always present in excess in the water. Since it never becomes scarce or limiting, there is no reason to model it. Another difference from the marine phosphorus cycle is the significant loss of reactive nitrogen due to denitrification or anammox, both of which processes transfer reactive nitrogen back to N2.
Two types of phytoplankton
Marine photosynthesizers which can fix N2, such as many cyanobacteria, have an advantage when reactive nitrogen is scarce (as long as PO4+ is also available) since they are not reliant on that limited supply. However, they are at a disadvantage compared to other phytoplankton when reactive nitrogen is more abundant, since N2-fixation requires more energy to use (if it were otherwise then all phytoplankton would make use of the large N2 reservoir and ignore the other forms of nitrogen). There are also physiological difficulties involved in using N2 since photosynthesis generates oxygen whereas nitrogenase, the enzyme used for N2-fixation, is degraded by exposure to oxygen. These general characteristics of N and P use are represented in the model as shown in the diagrams to the right. To encode for the greater cost of nitrogen fixation, the nitrogen-fixing algae are given a slightly lower maximum growth rate. In line with normal practice, nutrient limitation of growth rate is calculated according to the Michaelis-Menten formula (equations (1) and (2) below).
For the other (non-fixing, i.e. reactive nitrogen-using) phytoplankton, the combined limitation due to N and P together is calculated according to Liebig's law. That is to say, the combined limitation is made equal to the minimum of the two individual limitations. The greater requirements of such algae for iron are not represented in this model, despite observational evidence that availability of Fe may be important for determining N2-fixer occurrence. Both types of algae are subjected to a mortality term, representing losses due to grazing (consumption by zooplankton), sinking and mixing of cells out of the sunlit zone. For the N2-fixing phytoplankton, growth is able to continue regardless of scarcity in reactive nitrogen.
State variables and equations
There are only six variables in the model, representing both nutrients, NO3- (fixed nitrogen) and PO4+, in both of the boxes, and two types of phytoplankton restricted to the surface box. The governing equations for these variables are given by the equations below.
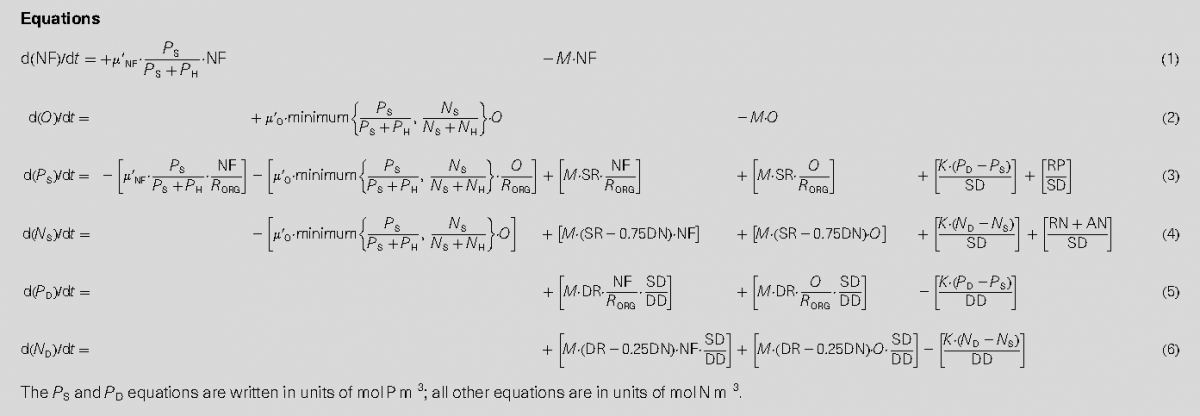
Equations (1) and (2) together give the nitrogen-fixers a growth advantage when both reactive nitrogen is in short supply and phosphorus is relatively abundant; but these equations put the other phytoplankton at an advantage otherwise. Growth rate differences translate to abundance differences (out-competition of one phytoplankton group by the other) because both phytoplankton are given the same mortality rate, and because of restricted phosphate availability which sets a limit to the total biomass that can be supported. The calculation of phytoplankton growth rates omits the effects of light, temperature, silicate and micronutrient (for example, iron) limitations on growth rate, all of which are important over some parts of the surface ocean at some times. To compensate, the phytoplankton are given lower maximum growth rates than laboratory and field experiments indicate for optimal growth conditions.
Equations (3)-(6) in the box above simulate the processes of riverine and atmospheric (for nitrogen) inputs to the ocean, assimilation of nutrients into organic matter (new phytoplankton growth), remineralization of that organic material in surface and deep waters, sedimentation of a small portion of the organic material, mixing of nutrients between deep and surface waters, and finally loss of reactive nitrogen due to denitrification and anammox. Denitrification and anammox are represented simply as a fixed proportion (1.5%) of the total remineralization. They are assumed to occur predominantly in the upper 500m of the ocean (75%), but also partly at greater depth (25%), for instance in sediments.
Model parameters
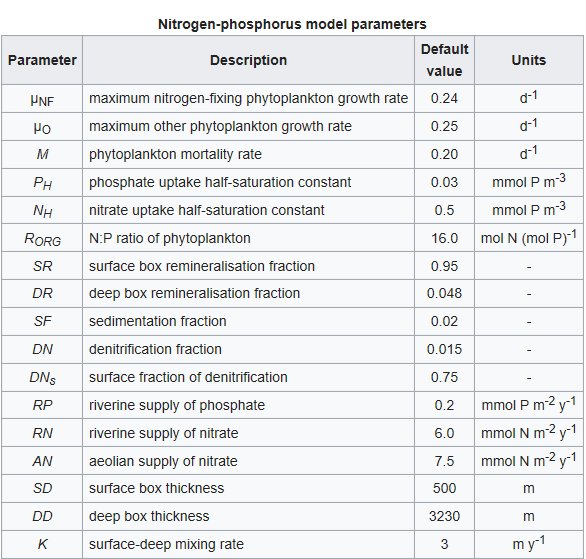
Other symbols in the equations above signify a series of parameters that regulate the rates of the processes described above. These are listed in the table below together with a description of each and their default values. The values of all of these parameters can be altered in the model.
The calculation of phytoplankton growth rates omits the effects of light, temperature and other nutrients on growth rate, all of which are important over some parts of the surface ocean at some times. To compensate for this omission, the phytoplankton are assigned a lower maximum growth rate than either laboratory or field experiments indicate should otherwise be the case.
Tyrrell, T. (1999). The relative influences of nitrogen and phosphorus on oceanic primary production. Nature 400, 525–531.