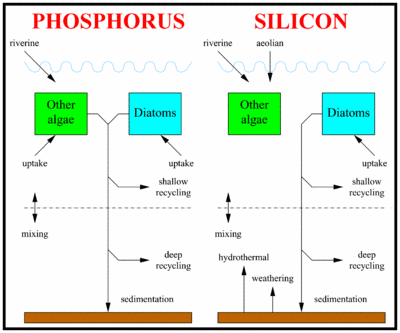
Silicon-phosphorus model worksheet
The aim of this silicon-phosphorus model worksheet is to analyse some of the properties of the silicon-phosphorus model, as well as helping users to become familiar with running the JModels.
Worksheet
Yool & Tyrrell (2003) state that the silicon-phosphorus model: (1) regulates Si concentrations homeostatically; (2) is insensitive to most parameter values and structural/process assumptions; (3) but is dependent on two main assumptions, that μD > μO and μO > M (where μ denotes a maximum growth rate, subscript ‘D’ denotes diatoms, subscript ‘O’ denotes other (non-siliceous) algae, and M is the constant mortality). Test these statements as follows:
1. Try starting the model with: (a) deep P 10-fold lower, all else the same; (b) deep Si 10-fold lower, all else the same; (c) deep Si 10-fold higher, all else the same; and see whether/how the model converges to steady state.
2. Change the following parameters by +/- 25% and see if the model still converges to a similar steady-state: Rorg, the ideal Si:P ratio in diatoms; SR, the surface remineralisation fraction of organic phosphorus; SRs, the surface remineralisation fraction of biogenic silica; SFs, the fraction of biogenic silica that is buried; RS, the riverine input of silicic acid.
3. Change the following parameters by +/- 25% and see if the model still converges to a similar steady-state: μD, diatom maximum growth rate; μO, other algae maximum growth rate; and M, phytoplankton mortality rate.
4. How quickly will the ocean rid itself of excess silicic acid? Test this timescale by initialising the model with 1200 mmol Si m-3 (this is the threshold above which inorganic silica spontaneously precipitates out of seawater) and examine the model results to see how long it takes for the increased silica burial rate to return the ocean to near steady-state.
5. Make a ten-fold reduction in the initial concentration of deep silicate. How long does it take the deep silicate concentration to return to equilibrium? (calculate this as the time until 95% of the original perturbation is removed)
6. First double and then halve the deep silicate concentration, while leaving all other variables at their default values. Save the data and then examine the burial fluxes of solid silica shortly after the alterations. How do they compare?
Once you have completed these questions, follow this link for the answers.
Yool, A. & Tyrrell, T. (2003). Role of diatoms in regulating the ocean's silicon cycle. Global Biogeochemical Cycles 17, 1103, doi:10.1029/2002GB002018.
Description of the chemical element silicon
Diagram of the silicon cycle

