Silicon-phosphorus model details
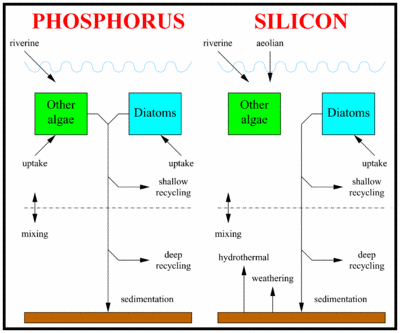
A schematic of the modelled silicon and phosphorus cycles.
This article provides information on silicon-phosphorus model details, including the ordinary differential equations and parameters that describe the model. As with the other two nutrient models, the aim of this model is to strip away much of the complexity of the real ocean and its component ecosystems in order to focus on the key processes that regulate silicic acid concentrations in the ocean.
Overview
The schematic to the right shows how the oceanic cycles of silicon and phosphorus are represented in the model. The model is a standard one-dimensional, two-box model of the global ocean, with the top layer representing the surface ocean down to the limit of the deepest wind-induced mixing during the year (down to the annual thermocline) and the bottom layer representing the deep ocean.
There is a simple representation of the physical processes that transfer silicon and phosphorus vertically in the ocean. This occurs in reality partly through mixing between the surface and deep oceans, partly through the physical movement of large masses of water between the surface and deep layers (upwelling and downwelling; ocean circulation), and partly due to diffusion. These physical processes are simulated by exchanging a slab of water between the surface and deep boxes. The rate of exchange equates to swapping a slab of thickness 3 metres between the two layers every year (according to the standard value of the parameter K).
The biogeochemical model
The ocean’s biogeochemistry is reduced here to two nutrients and two phytoplankton groups. Both nutrients are present in both ocean boxes, but the phytoplankton are confined to the surface box. The figure to the right shows a diagrammatic overview of the model biogeochemistry. The nutrients included in the model are phosphate and silicic acid (also known as silicate). Because of its important role in genetic and metabolic machinery, phosphate is required by all algae, but silicon is only needed in significant quantities by diatoms.
Both nutrients are supplied to the ocean by rivers, and silicic acid has additional inputs from the atmosphere, and also from hydrothermal sources and from weathering of the seafloor. Both nutrients are consumed by algae in the model’s surface layer and remineralized down the water column when the algae die and sink into the ocean.
The rates at which the two nutrients are remineralized are different (phosphate remineralizes faster, and therefore higher in the water column, than silicic acid), and this is reflected in the model by different partitioning of remineralization between the two ocean boxes. Small fractions of the sinking fluxes of both nutrients are lost permanently from the model system through the sedimentation and burial of biogenic material on the seafloor. Again, the two nutrients differ in the fraction of sinking material that is ultimately buried and lost from the model.
Phytoplankton groups
The model includes two phytoplankton groups: the diatoms and other algae. More generally these represent siliceous algae (diatoms, silicoflagellates, etc.) and non-siliceous algae. The diatoms require both silicic acid and phosphate to grow, and uptake these nutrients in a variable ratio. Their growth rate is controlled by the most limiting of the two nutrients according to a Liebig’s Law formulation (the lesser of the two different nutrient limitations for diatoms is used to determine the overall limitation). The growth rate of the other algae is controlled solely by the availability of phosphate.
Within the bounds imposed by their differing nutrient requirements, both algal groups are modelled and parameterised in the same way. Both use the same Michaelis-Menten uptake curve for phosphate, and both algae are assumed to die at the same rate. However, the maximum growth rates of the two algal groups are not equal. As diatoms are generally found to be superior competitors wherever silicic acid is not limiting, their maximum growth rate is set at a value fractionally greater than that of the other algae to give them a competitive edge. This approach aims to simplify the ecological model to the assertions that:
1. all other things being equal, diatoms are superior competitors
2. only diatoms require (and are potentially limited by) silicic acid
Other differences between diatoms and the other algae (e.g., photosynthesis/nutrient coefficients, respiration/mortality/sinking rates, etc.) are, for the purposes of clarity, ignored. The sensitivity of the model to many of these assumptions has been explored in detail in Yool & Tyrrell (2003).
While only diatoms are modelled here, other groups, notably the sponges and radiolarians, also utilize silicic acid. However, although these groups have been important in the silicon cycle of earlier Eras, they play relatively minor roles in the contemporary ocean.
State variables and equations
The model has six state variables corresponding to diatoms, D, other algae, O, surface phosphate, Ps, surface silicic acid, Ss, deep phosphate, Pd, and deep silicic acid, Sd. Since it is the sole common currency, both phytoplankton equations are written in terms of phosphate. Units are mol m-3.
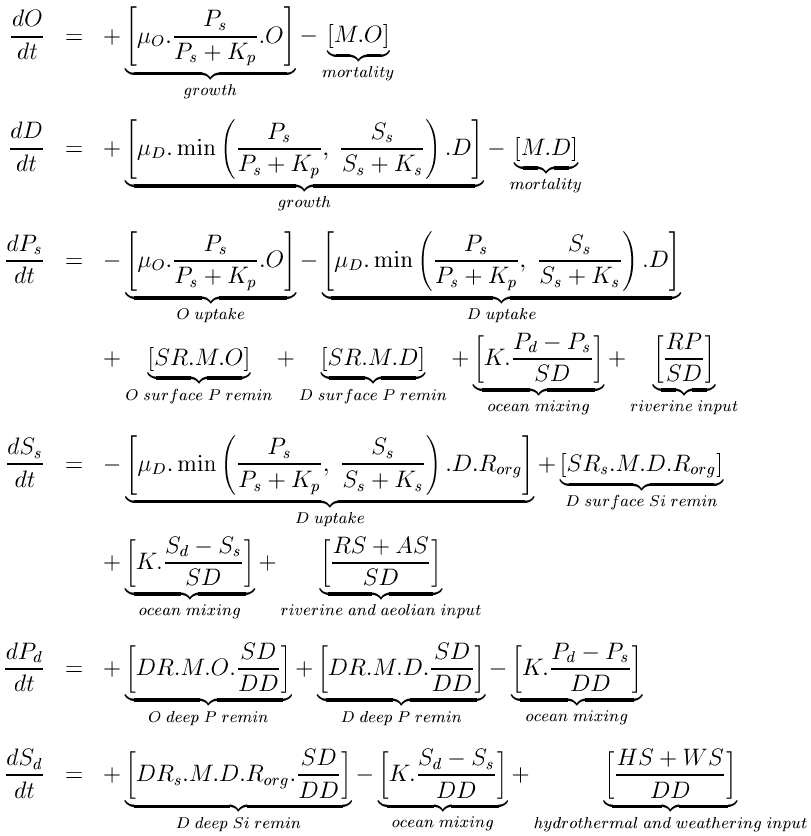
Phytoplankton
Both phytoplankton equations are composed of two terms. The first is a simple growth term, relating population increase to the current population, a maximum growth rate (O or D), and a standard Michaelis-Menten term for nutrient uptake. In the diatom equation, the lower of the two nutrient limitation terms controls the rate of population increase through a Liebig’s Law formulation. The second term in the phytoplankton equations is a loss rate, removing a constant fraction (M) of the phytoplankton populations. This term simplifies all of the possible loss pathways for phytoplankton (e.g., grazing, respiration, sinking, disease) down to a single, linear rate.
Phytoplankton growth and loss terms dominate the fluxes for both modeled nutrients. Growth reduces surface concentrations of nutrients, while phytoplankton losses are returned to both ocean boxes by the remineralization of sinking biogenic material. Remineralization is modeled as the fractions of the sinking flux of biogenic material that are remineralized within each ocean layer. In reality, these fractions vary with detrital sinking speed and with remineralization rate, which themselves vary with a range of factors.
Unlike the ratios between the other major elements, the ratio between silicon and phosphorus (or carbon or nitrogen) can be extremely variable in diatoms. First, silicic acid uptake, unlike that of nitrate and phosphate, is decoupled from photosynthesis, although it is still ultimately dependent on the energy provided by photosynthesis. Further, silicification is tightly coupled to the cell division cycle, resulting in the extent of silicification being dependent on the duration of the division cycle. The slower a cell grows, the longer a period it has to uptake silicic acid, and so the more heavily silicified it becomes (assuming silicic acid is abundant relative to other limiting factors). For example, the availability of iron, known to be regionally variable, is widely believed to play a role in the silicic acid utilization in diatoms via its effects on cell growth rates, with the result that higher Si:P ratios are found within diatoms growing in iron-limited regions.
In the equations above, this general relationship is modeled by relating the Si:P ratio, Rorg, to a function of the silicic acid uptake rate and the Liebig term. When silicic acid most limits the diatoms a Si:P ratio of 16 results (this is assumed to be the minimum Si:P ratio). However, where silicic acid is more plentiful and phosphate most limits the diatoms (i.e., extends the duration of the cell division cycle) Rorg increases above 16. The minimum ratio used here should be viewed as the diatoms' ideal ratio: When conditions are good, and both nutrients are non-limiting, this is the ratio that will result within actively growing diatom populations. Essentially, while the relationship used here simplifies a complex process, it captures a major facet of the Si:P ratio and, from a practical point of view, requires no extra parameters beyond the ideal Si:P ratio.
Other biogeochemistry
Aside from the biologically controlled fluxes, both nutrients are constantly added to the ocean from terrestrial or seafloor reservoirs. In the case of phosphate, these are confined to riverine fluxes entering the surface layer (RP). Riverine fluxes dominate silicic acid additions to the ocean, but these are supplemented by aeolian inputs (also to the surface layer), and hydrothermal and seafloor weathering inputs which enter the deep layer of the model (respectively, RS, AS, HS, and WS). Since the representation of ocean physics is primitive, nutrients in the two layers are simply mixed at a constant rate (K) between the two ocean layers.
An important process only implicit in the equations above is the burial and permanent loss of material from the ocean system. As outlined above, sinking biogenic material is remineralized down the water column, with the two layers receiving fractions (SR, DR, SRs and DRs) of the total biogenic flux. For both nutrients, these fractions sum to less than 1, and residual quantities of material leave the modeled system (SF and SFs). Given that there are constant inputs from riverine and other sources, and that this burial flux is the only "exit" from the model system, it is an important pathway in determining the ocean’s equilibrium state, despite being invisible in the model equations.
Model parameters
Other symbols in the equations above signify a series of parameters that regulate the rates of the processes described above. These are listed in the table below together with a description of each and their default values. The values of all of these parameters can be altered in the model.
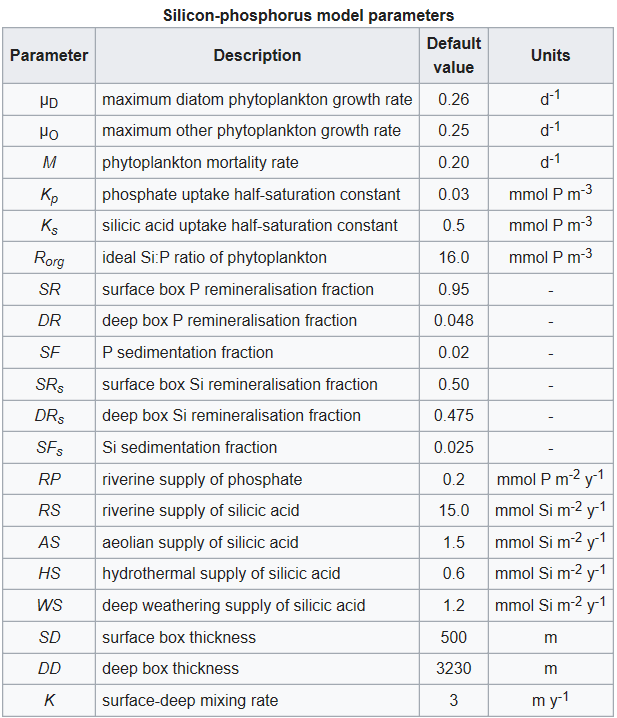
The majority of the model parameters are the same as those in the nitrogen-phosphorus model. Both models share the same phosphate cycle submodel, and the parameters they have in common are given identical values here. One slight difference lies in the values assigned to the phytoplankton maximum growth rates. In the nitrogen-phosphorus model the other algae are given a slight advantage over their nitrogen fixing competitors (0.25 day-1 versus 0.24 day-1), while in this model the diatoms are given a similarly slight advantage over the other algae (0.26 day-1 versus 0.25 day-1). Both algae experience the same mortality rate (M = 0.20 day-1).
These maximum growth and death rates are considerably lower than most values obtained from the field and cultures. However, as the model is a global annual model, these higher rates have been modified to reflect the growth rates experienced by phytoplankton on this time and space basis.
The parameterization of the silicon cycle sub-model is mostly based on the comprehensive review of Treguer et al. (1995). This review summarizes the current best estimates for the fluxes of silicic acid through the ocean, and constructs a budget for silicon for the global ocean. The values of the parameters dealing with fluxes of silicic acid into the ocean (RS, AS, HS, and WS) are simply taken from this budget. The pattern of dissolution of biogenic silica down the water column in the model is also taken from the budget.
To determine their use of silicic acid, two other diatom parameters need to be specified: silicic acid uptake half-saturation, Ks, and minimum silicon to phosphorus uptake ratio, Rorg. Not uncommonly for biological variables, both of these parameters have wide ranges in the literature, though both also appear to vary with other properties such as ambient silicic acid or cell division rate. Following Louanchi & Najjar’s (2000) global survey of nutrient cycles a minimum Si:N ratio of 1:1 has been chosen, which translates to an Si:P ratio of 16:1. This ratio also matches that found by Dugdale & Wilkerson (1998) in their regional study of diatom production in the equatorial Pacific upwelling zone.
- Dugdale, R. C. and Wilkerson, F. P. (1998). Silicate regulation of new production in the equatorial Pacific upwelling. Nature 391, 270–273.
- Louanchi, F. and Najjar, R. G. (2000). A global monthly climatology of phosphate, nitrate, and silicate in the upper ocean: Spring-summer export production and shallow remineralization. Global Biogeochemical Cycles 14, 957–977.
- Treguer, P., Nelson, D. M., Van Bennekom, A. J., DeMaster, D. J., Leynaert, A., and Queguiner, B. (1995). The silica balance in the world ocean: A reestimate. Science 268, 375–379.
- Yool, A. & Tyrrell, T. (2003). Role of diatoms in regulating the ocean's silicon cycle. Global Biogeochemical Cycles 17, 1103, doi:10.1029/2002GB002018.