Phosphorus model details
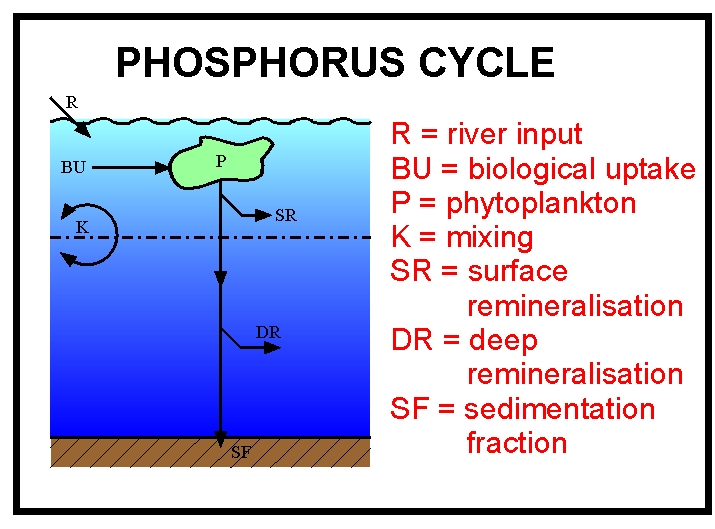
A schematic of the model phosphorus cycle
This article provides information on phosphorus model details, including the ordinary differential equations and parameters that describe the model. As with the other two nutrient models, the aim of this model is to strip away much of the complexity of the real ocean and its component ecosystems in order to focus on the key processes that regulate phosphate concentrations in the ocean.
Overview
The schematic to the right shows how the oceanic cycle of phosphorus is represented in the model. The model is a standard one-dimensional, two-box model of the global ocean, with the top layer representing the surface ocean down to the limit of the deepest wind-induced mixing during the year (down to the annual thermocline) and the bottom layer representing the deep ocean.
There is a simple representation of the physical processes that transfer phosphorus vertically in the ocean. This occurs in reality partly through mixing between the surface and deep oceans, partly through the physical movement of large masses of water between the surface and deep layers (upwelling and downwelling; ocean circulation), and partly due to diffusion. These physical processes are simulated by exchanging a slab of water between the surface and deep boxes. The rate of exchange equates to swapping a slab of thickness 3 metres between the two layers every year (according to the standard value of the parameter K).
State variables and equations
The model is stripped down to the simplest form that can still reproduce the essential aspects of how phosphorus (in the form of phosphate) cycles in the oceans. There are only three state variables in the model:
the concentration of phosphate in the upper (surface) box (PS)
the concentration of phosphate in the lower (deep) box (PD)
the concentration of phytoplankton in the surface box only (A)
The ordinary differential equations for the three state variables are:
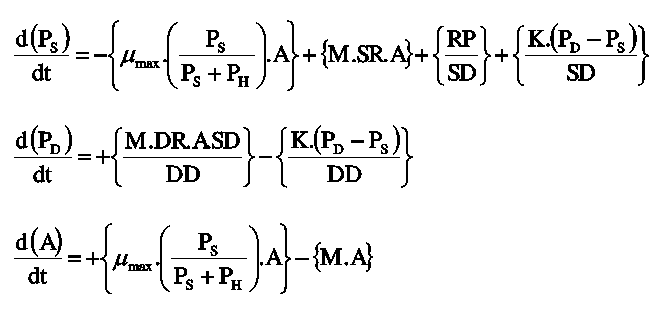
Equation 1
The first term calculates uptake of phosphorus (as phosphate) by phytoplankton; the second represents remineralisation of organic material back to phosphate in the surface box; the third term is the net exchange of phosphate due to mixing between the surface and deep ocean boxes; and the fourth term represents riverine input of phosphate.
Equation 2
The first term represents remineralisation of organic material back to phosphate in the deep box; and the second term is the net exchange of phosphate due to mixing between the deep and surface ocean boxes.
Equation 3
The first term is new growth of algal biomass, determined according to phosphate limitation (PH is the Michaelis-Menten half-saturation constant that defines the way in which scarcity of phosphate impacts on growth rate); and the second term is the loss of algal cells due to mortality (M) processes such as grazing by zooplankton.
Model parameters
Other symbols in the equations above signify a series of parameters that regulate the rates of the processes described above. These are listed in the table below together with a description of each and their default values. The values of all of these parameters can be altered in the model.
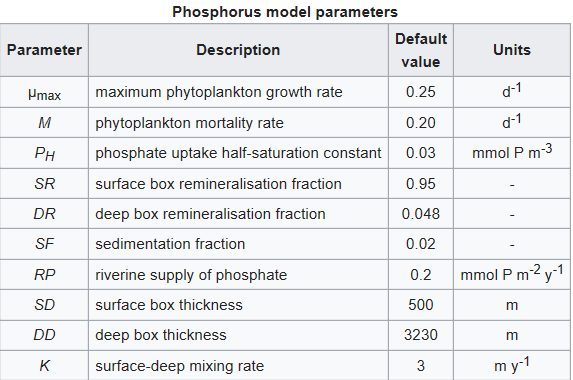
The calculation of phytoplankton growth rates omits the effects of light, temperature and other nutrients on growth rate, all of which are important over some parts of the surface ocean at some times. To compensate for this omission, the phytoplankton are assigned a lower maximum growth rate than either laboratory or field experiments indicate should otherwise be the case.
The parameter values for the phosphorus model are the same as those used in the nitrogen-phosphorus model.
Further Information
Phosphorus model overview
Phosphorus model details
Phosphorus model model cons
Phosphorus model pros
Phosphorus model help
Phosphorus model worksheet
References
The phosphorus cycle model has not been published separately, though it is a key component of the nitrogen-phosphorus, silicon-phosphorus and carbon models.
Chuck, A. et al. (2005). The oceanic response to carbon emissions over the next century: investigation using three ocean carbon cycle models. Tellus B 57, 70-86.
Tyrrell, T. (1999). The relative influences of nitrogen and phosphorus on oceanic primary production. Nature 400, 525–531.
Yool, A. and Tyrrell, T. (2003). Role of diatoms in regulating the ocean's silicon cycle. Global Biogeochemical Cycles 17, 1103, doi:10.1029/2002GB002018.
External links
Description of the chemical element phosphorus
Description of the phosphorus cycle