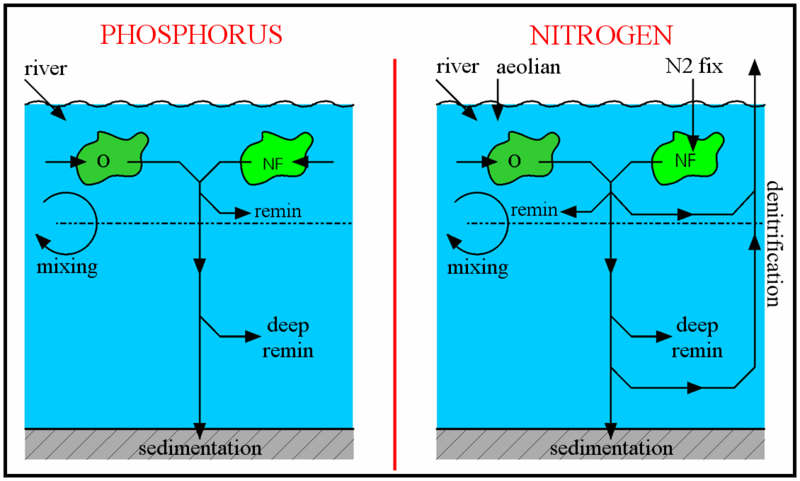
The article provides answers to the questions posed in the nitrogen-phosphorus model worksheet.
Worksheet answers
1. Try some different types of initial conditions: e.g. (a) low nitrate (N), all else the same; (b) high N; (c) low P; (d) high P. Does the model always converge to a steady state?
Yes. Starting, for instance, from deep [NO3] = 2.3 or 50.3, or deep [PO4] = 0.2 or 3.0, the model always converges towards a stable final state (flat lines in all graphs).
2. Is it always the same steady state?
Yes. N2-fixers = 0.02 μMol P m-3; non-fixers = 2.72 μMol P m-3; surface [PO4] = 0.15 mMol m-3 ; deep [PO4] = 1.75 mMol m-3 ; surface [NO3] = 2.0 mMol m-3 ; deep [NO3] = 25.6 mMol m-3.
3. Try starting the model at steady state except for ten-fold less PO4 in the deep box. Try the same run in the P-only model. Is the behaviour the same in both models? In terms of surface and deep P concentrations, do the two types of model converge to the same sorts of P concentrations?
P behaviour is near-identical in the two models (slight differences, but not important).
4. Run the model in steady-state and examine the fluxes. Now run the model again and examine the fluxes shortly after: (a) doubling the deep nitrate concentration, and (b) after halving it. Which fluxes have changed between the three runs? Are the changes in the right direction to restore the N:P ratio to its steady-state value? [to calculate this, use the facility to "save data" and then examine it in Excel or Matlab]
They do agree. Only the N2-fixation flux is different. Yes, the changes act to return the N:P ratio to its steady-state value (negative feedbacks).
5. Try quadrupling the denitrification rate (the fraction of organic biomass that is remineralised via denitrification) in the standard model and examine the new steady-state that the model converges to. The denitrification flux should now equal ~488 Tg N y-1. Assuming other fluxes are as in the first figure overleaf, how large would the N2-fixation flux need to be in order to create a balance between inputs and outputs? Is it that size?
Without N2-fixation the imbalance is 488 + 16 – 30 – 38 = 436 Tg N y-1. N2-fixation takes up the slack (increases to that value, in steady-state). Nitrogen-fixation increases because denitrification removes reactive nitrogen (represented by nitrate in the model) from the system, and so conditions are made more favourable for those phytoplankton able to get nitrogen from other sources, i.e. N2 (which is always plentiful).
6. Similarly with the atmospheric input of nitrogen, what effect does a 25% reduction in AN (atmospheric nitrogen deposition) have on steady-state fluxes?
Again nitrogen-fixation increases to take up the slack and bring extra nitrogen into the system.
7. From the steady-state, try increasing RP (river delivery of phosphate) by 25%. What effect does this have on TPP? Reset the model parameters to their default values, run to steady-state again, then try increasing RN (river delivery of nitrate) by 25%. What effect does this have on TPP?
Increasing RP increases TPP proportionately. Increasing RN has no effect.
8. Look at the figures from the increased RN run. Why does increasing RP have an effect on TPP, but increasing RN have none? How is this possible when surface nitrate is more limiting to the ‘other’ phytoplankton?
Increased RP → more PO4 in the system → increased nitrogen fixation (because extra PO4 not initially accompanied by extra NO3) → more NO3 brought into the system → more of both PO4 and NO3 → increased TPP. Conversely, increased RN → more NO3 in the system → decreased nitrogen fixation (because extra NO3 not initially accompanied by extra PO4) → less NO3 brought into the system → no net increase in either PO4 or NO3 → no effect on TPP.
9. Can you explain how/why it is possible to have distinct proximate and ultimate limiting nutrients?
It is because the population of nitrogen-fixers is limited and controlled by phosphate: in the model, nitrogen-fixer growth rate (μ = μmax * PLIM) is dependent only on phosphate. Although nitrogen-fixers typically make up only a small fraction of the total phytoplankton community, they also act as a conduit for bring new nitrate into the system and in this way their activities also influence the nutrient levels for the other phytoplankton.
Other related pages
Nitrogen-phosphorus model overview
Nitrogen-phosphorus model details
Nitrogen-phosphorus model cons
Nitrogen-phosphorus model Pros
Nitrogen-phosphorus model worksheet
References
Tyrrell, T. (1999). The relative influences of nitrogen and phosphorus on oceanic primary production. Nature 400, 525–531.
External links
Description of the chemical element nitrogen
Description of the nitrogen cycle