As with any model, simplification has both advantages and disadvantages. This article describes some of the silicon-phosphorus model pros.
Types of Models
In computer modelling there is a continuum between two caricature classes of models:
conceptual-type models that aim to simplify a system down to include only its most important elements, in particular those that govern its behaviour
simulation-type models that are highly detailed and try whenever possible to avoid making assumptions about what is important; instead they try to include as much detail as possible in the expectation that nothing important will be omitted
By simplifying to only the most important fluxes and state variables, this model is very much a conceptual-type model.
Advantages
One of the key advantages of such an approach is fast run times. The most detailed (fine spatial resolution) simulation models can, at the extreme, take many months of real time to simulate only a few decades. In contrast, this conceptual model can simulate hundreds of thousands of years in only a few seconds.
Leading on from this, a second advantage is the ease of experimentation and sensitivity with the quicker models such as this one. If each model run takes many months then the ability to carry out many different runs in series is limited. This is particularly important where uncertainty in the model formulation favours large numbers of sensitivity runs.
Another advantage of simpler models is the ability to understand why the model produces a particular behaviour. This is much harder, and sometimes impossible, with very complex models. It is not always possible to disentangle the large network of interacting effects in a complex model in order to work out which one is key, whereas it is easier in a simple model.
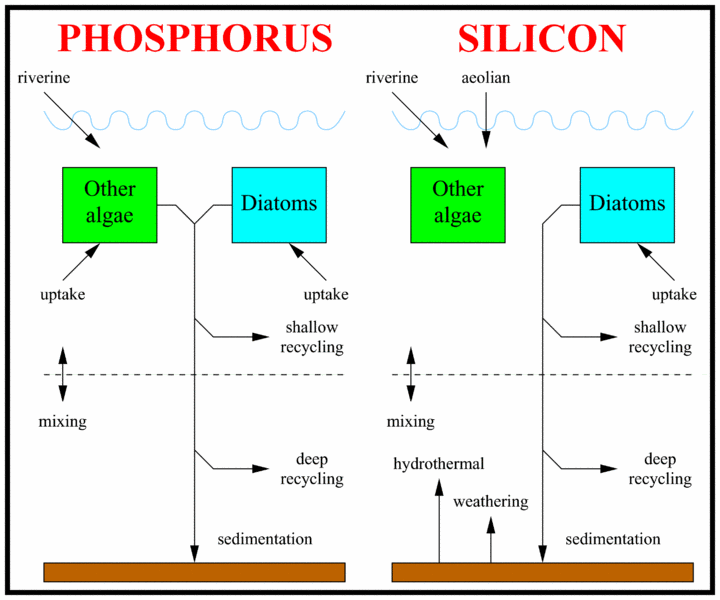
This model of the silicon and phosphorus cycles includes the quantitatively largest fluxes in the phosphorus cycle in the same way as the P-only model:
1. Uptake of P by phytoplankton
2. Release of P from phytoplankton organic matter upon decay
3. Downwards transport of P within sinking organic particles
4. Net upwards transport of P due to physical exchange of (nutrient-scarce) surface and (nutrient-rich) deep waters
5. Input of P to the ocean as a whole via river input
6. Loss of P from the ocean as a whole when organic particles sink to the seafloor, eventually get covered by further layers of sinking particles, and finally get compressed into marine sedimentary rocks
It also includes all of the largest fluxes in the silicon cycle:
1. Uptake of silicic acid (nitrate, nitrite, ammonium) by phytoplankton, the diatoms. The model also includes a variable Si:P ratio of diatom uptake
2. Release of Si from organic matter upon decay
3. Downwards transport of Si as part of sinking organic particles
4. Net upwards transport of silicic acid due to physical exchange of (nutrient-scarce) surface and (nutrient-rich) deep waters
5. Input of silicic acid to the ocean as a whole via river input, atmospheric deposition and seafloor hydrothermal and weathering inputs
6. Loss of silicon from the ocean as a whole when organic particles sink to the seafloor, are covered by further layers of sinking particles, and eventually compressed into marine sedimentary rocks
The model tracks the population dynamics of two separate groups of phytoplankton: the siliceous diatoms and non-siliceous other phytoplankton. The model includes the growth rate dependencies on phosphate and silicic acid availability (the non-siliceous phytoplankton are not affected by availability of silicic acid). By including the competition between these two groups, and its relation to nutrient concentrations, the model is able to include a feedback that links the silicon and phosphorus cycles together and provides a potentially stabilising negative feedback loop.
Some models are "closed-system" in the sense of forcing all substances to remain within the model ocean. Sinking material that reaches the seafloor, for instance, will be remineralised at the bottom (or top) of the ocean, and rivers will not be modelled. The boundaries of these models are absolute. This model is more realistic in the sense of being open-boundary (open-system). That is to say, it doesn't just simulate internal fluxes (moving Si and P around the ocean) but also the fluxes into and out of the ocean as a whole.
Other related pages
Silicon-phosphorus model overview
Silicon-phosphorus model details
Silicon-phosphorus model cons
Silica burp hypothesis
Silicon-phosphorus model worksheet
Refrences
Yool, A. & Tyrrell, T. (2003). Role of diatoms in regulating the ocean's silicon cycle. Global Biogeochemical Cycles 17, 1103, doi:10.1029/2002GB002018.
External links
Description of the chemical element silicon
Diagram of the silicon cycle
Description of the chemical element phosphorus
Description of the phosphorus cycle