Carbon model worksheet 3
Worksheet 3: Effect of pH on DIC composition

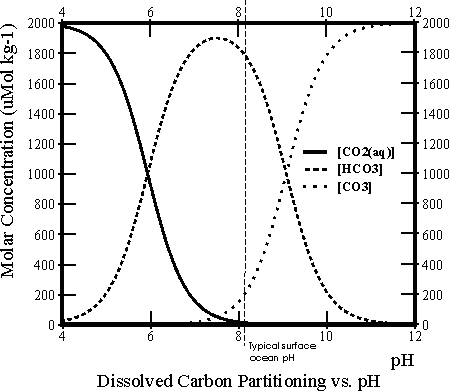
There are three different species of dissolved inorganic carbon in seawater: dissolved carbon dioxide gas (CO2(aq)), bicarbonate ions (HCO3-) and carbonate ions (CO32-) (actually there is also a fourth, H2CO3, but it is never quantitatively significant). At any one time the total dissolved inorganic carbon (DIC) is made up of some mixture of these three. The relative proportions of these vary as a function of pH, as shown in the Bjerrum line plot to the right.
- When CO2 gas diffuses through the sea surface and dissolves into seawater it makes the seawater more acidic. Looking at the Bjerrum plot, how would you expect a shift to lower pH to affect the % distribution of DIC into the different forms? Which out of [CO2(aq)], [HCO3-] and [CO32-] (where [ ] denotes ‘concentration of’) would you expect to become more abundant? which less so?
- Test out your predictions using the carbon model. Try adding 1000, 2000, 4000 and 8000 Gt of fossil fuel carbon to the atmosphere. What is the maximum impact on surface ocean pH in each case?
- What is the value of surface [CO2(aq)] in each case at the time of greatest deviation from its initial value? (NB. Atmospheric CO2 is not coupled to temperature in this model (temperature is constant through all model runs) and therefore atmospheric CO2 is directly proportional to the amount of CO2 gas dissolved in the surface seawater, [CO2(aq)]. Before fossil fuels are added, [CO2(aq)] is 10 μMol kg-1 in the model)
- Likewise what are the greatest changes to surface [CO32-] following the different fossil fuel additions?
- Finally, how does surface [HCO3-] change in each case? Because the model doesn’t plot out [HCO3-] directly you will need to calculate this by difference. { [DIC] = [CO2(aq)] + [HCO3-] + [CO32-] }
Once you have completed these questions, follow this link for the answers.
Refrences:
- Chuck, A. et al. (2005). The oceanic response to carbon emissions over the next century: investigation using three ocean carbon cycle models. Tellus B 57, 70-86.
- Tyrrell, T. (1999). The relative influences of nitrogen and phosphorus on oceanic primary production. Nature 400, 525–531.
- Tyrrell, T. et al. (2007). The long-term legacy of fossil fuels. Tellus B 59, 664-672.
