The PAP moorings were redeployed on 12 July 2003.
The telemetry which should communicate with the satellite to relay data was found to be inoperative and so was not deployed.
An extra cruise was arranged (Poseidon 306) in November at which time new satellite communication equipment was deployed and delayed mode data was recovered.
After recovery, data were archived at the British Oceanographic Data Centre (BODC) and can be accessed at: BODC PAP Collection (please use the search term Porcupine or #5192 to find our data) and temperature, salinity, conductivity and pressure data can be retrieved in user selected formats from the BODC ERDDAP service.
Delayed-mode Data
Temperature

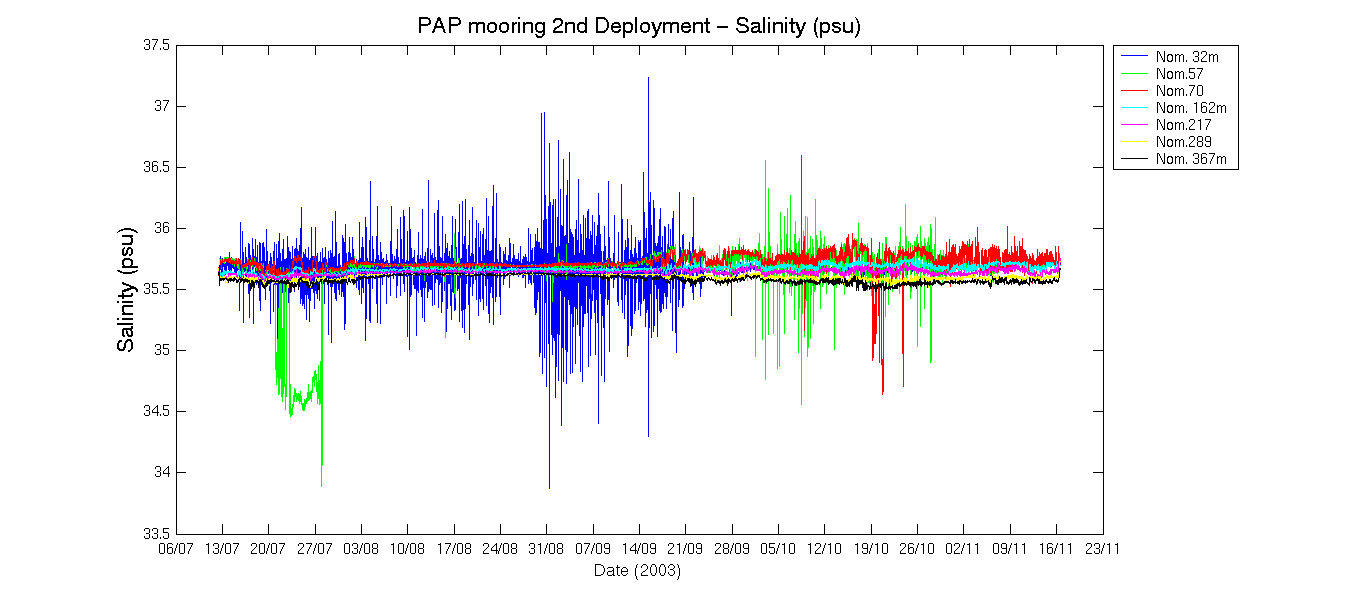
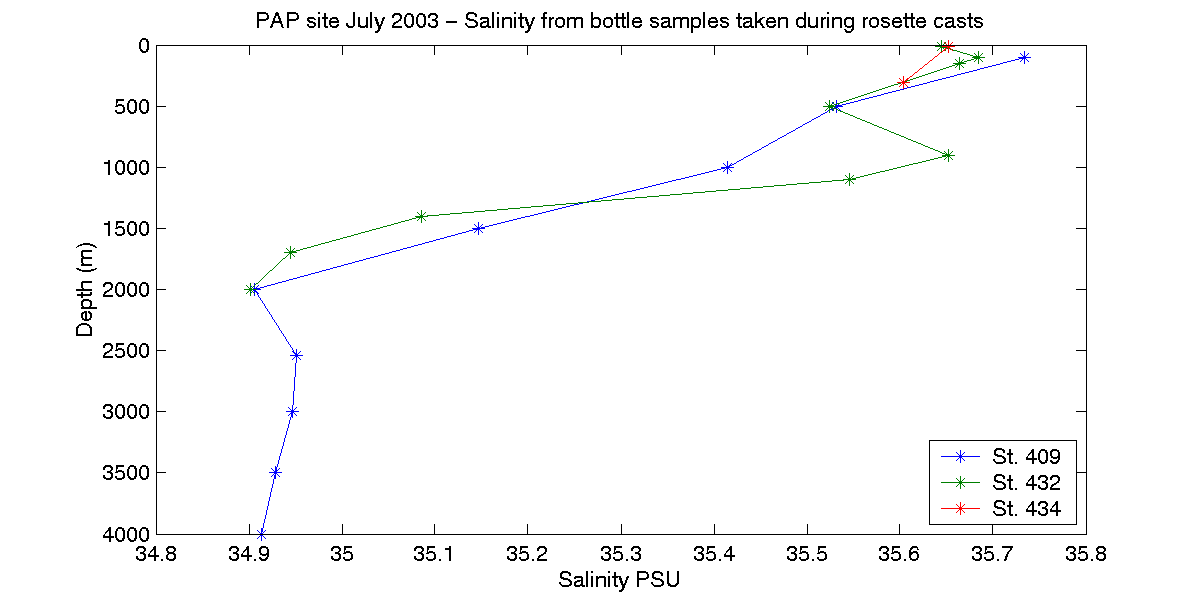
Salinity
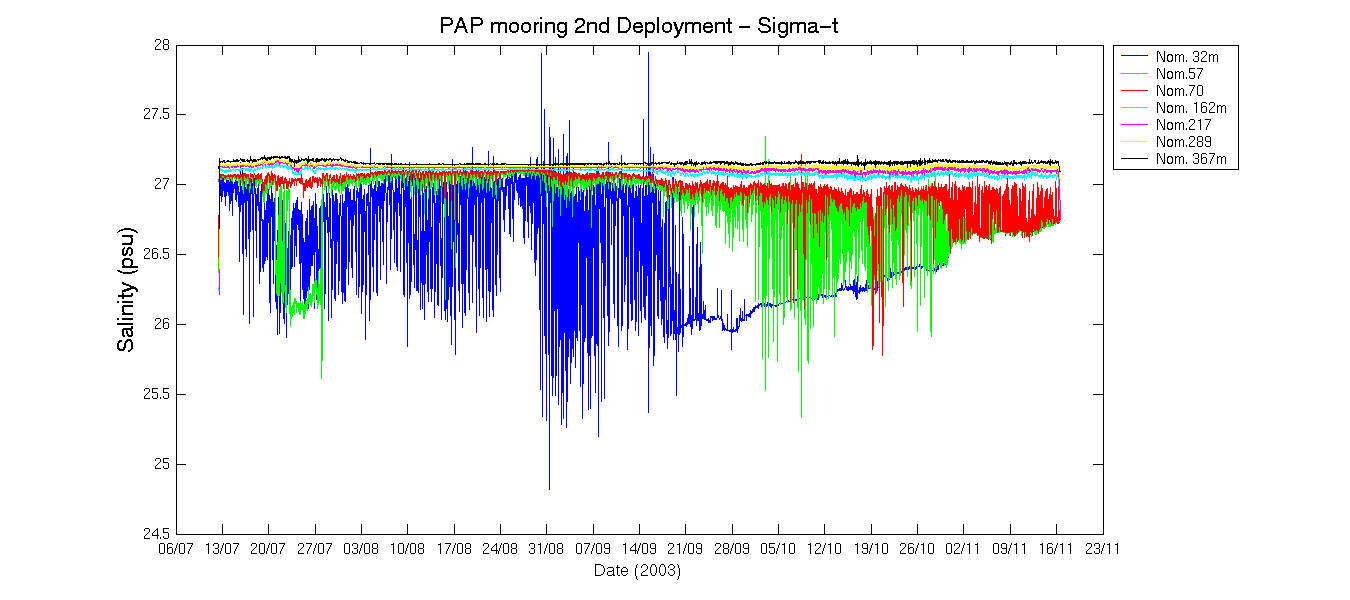
Sigma-t
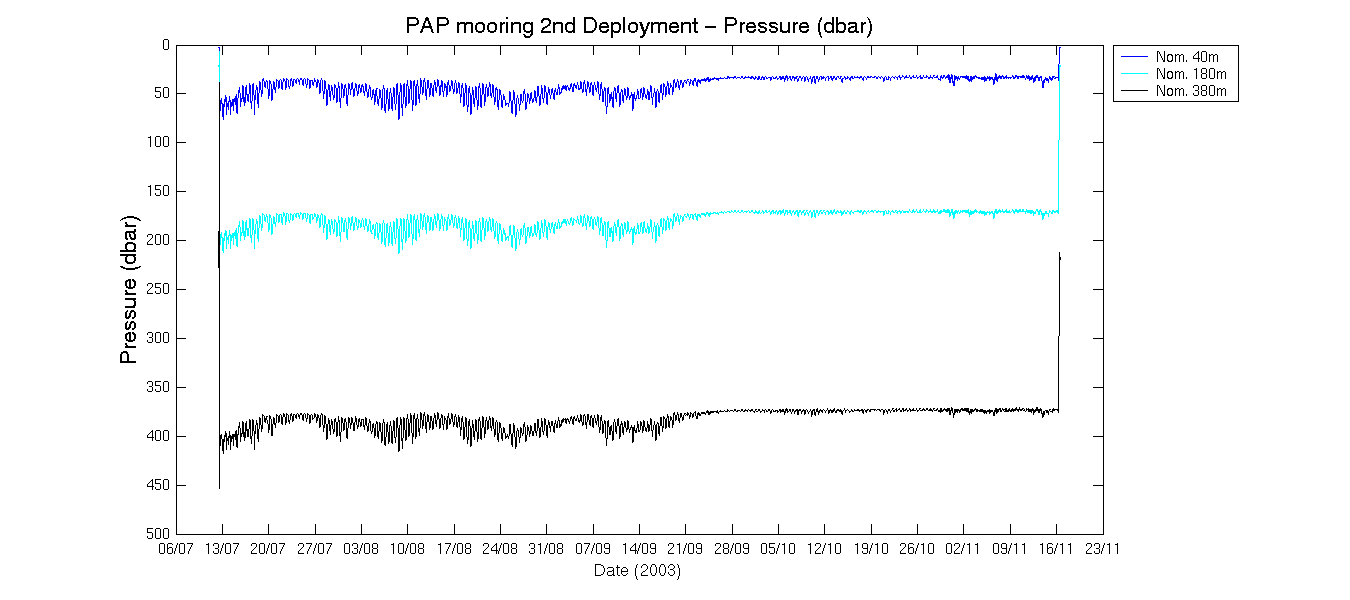
Pressure
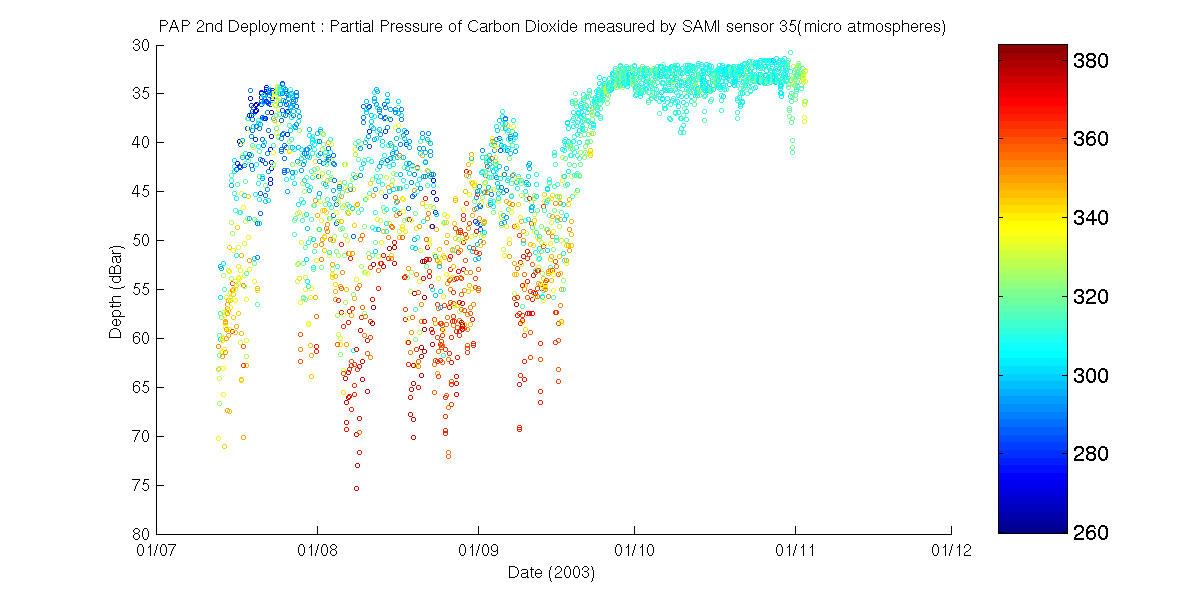
Carbon Dioxide
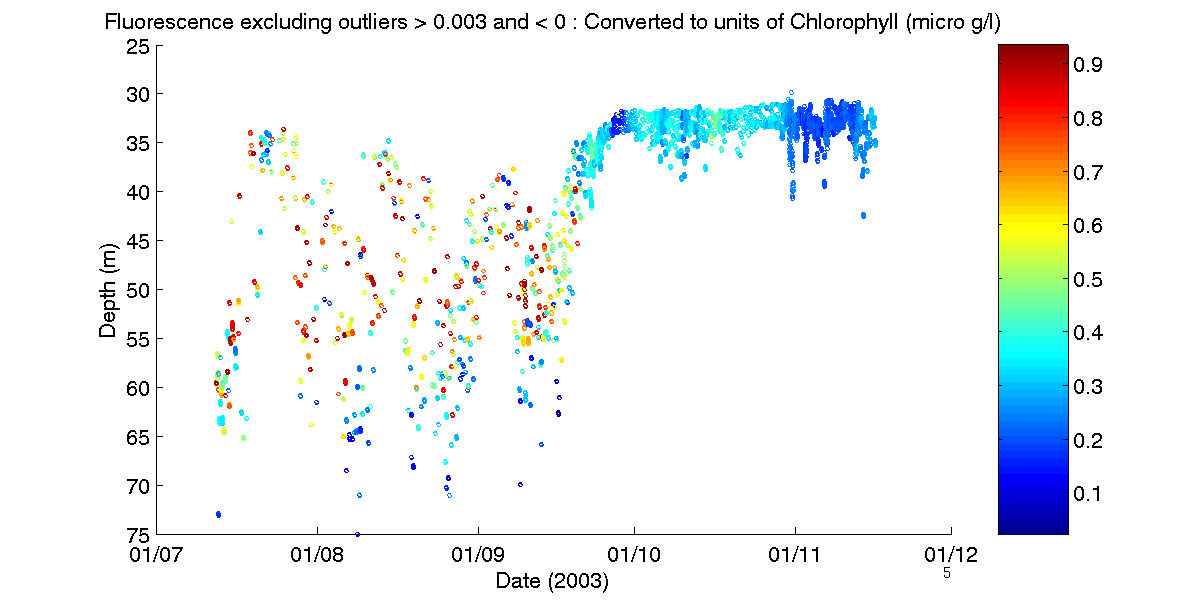
Chorophyll
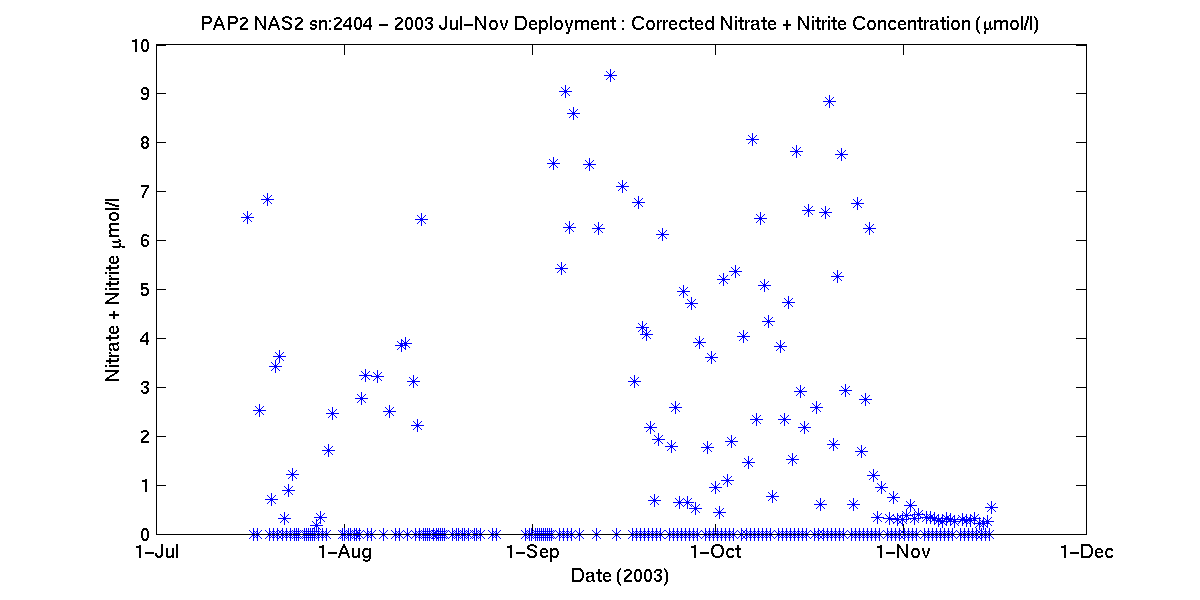
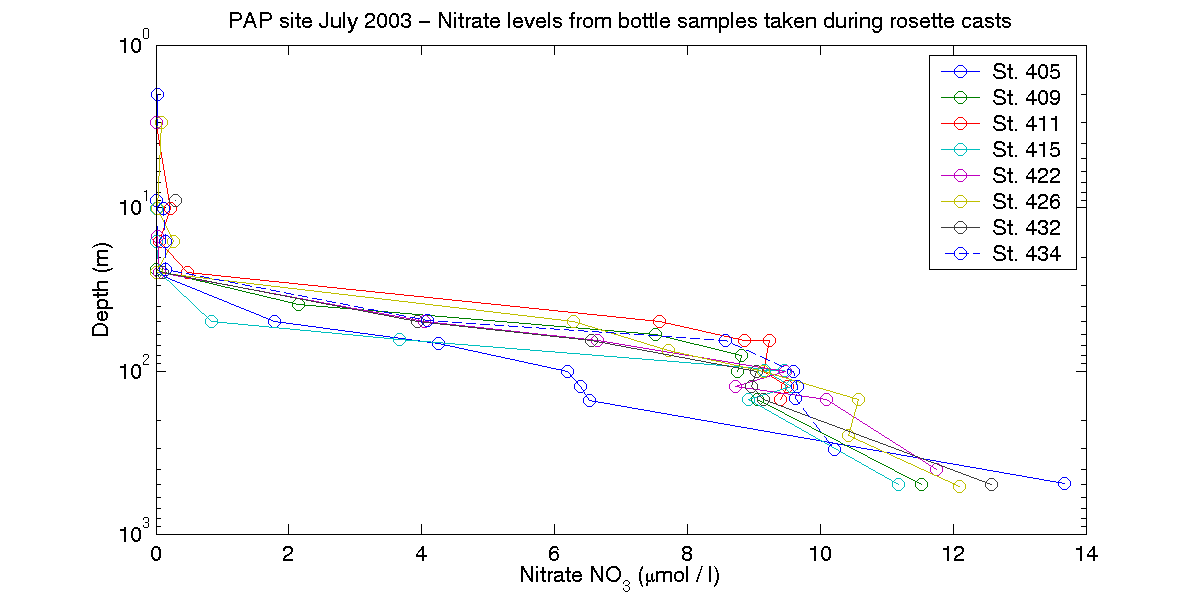
Nitrate (corrected)
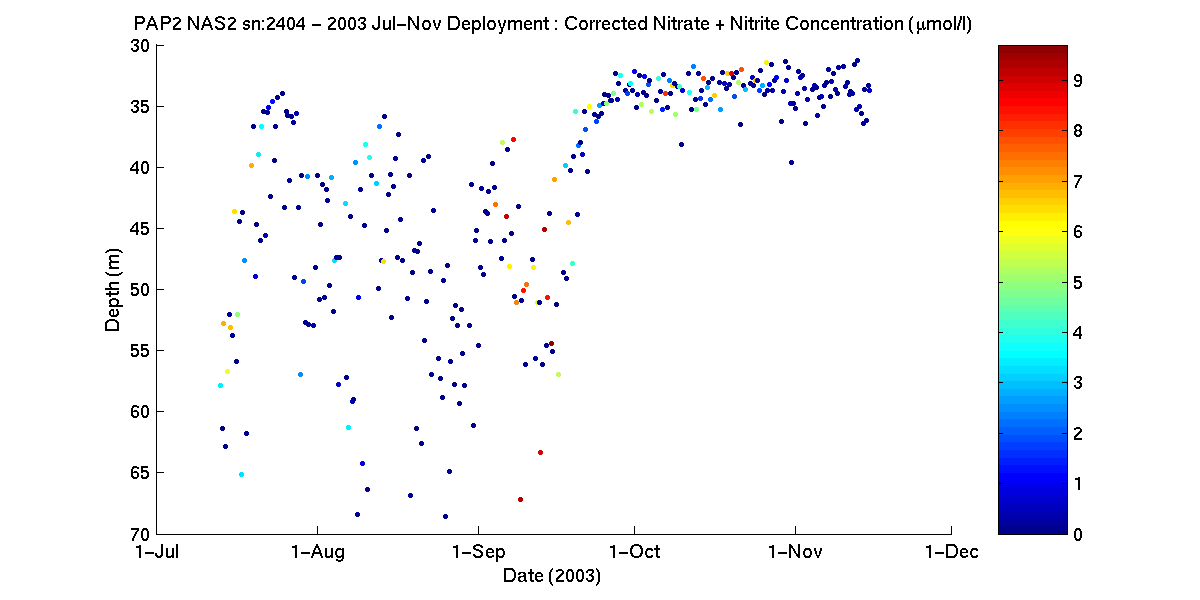
Nitrate (corrected)
Carbon Analysis
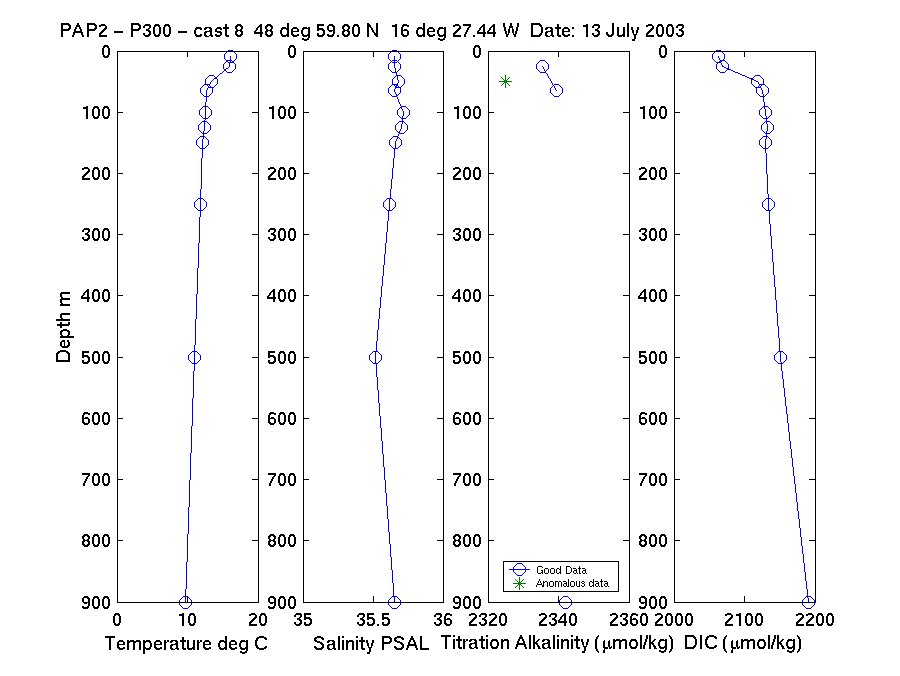
Nitrate Analysis
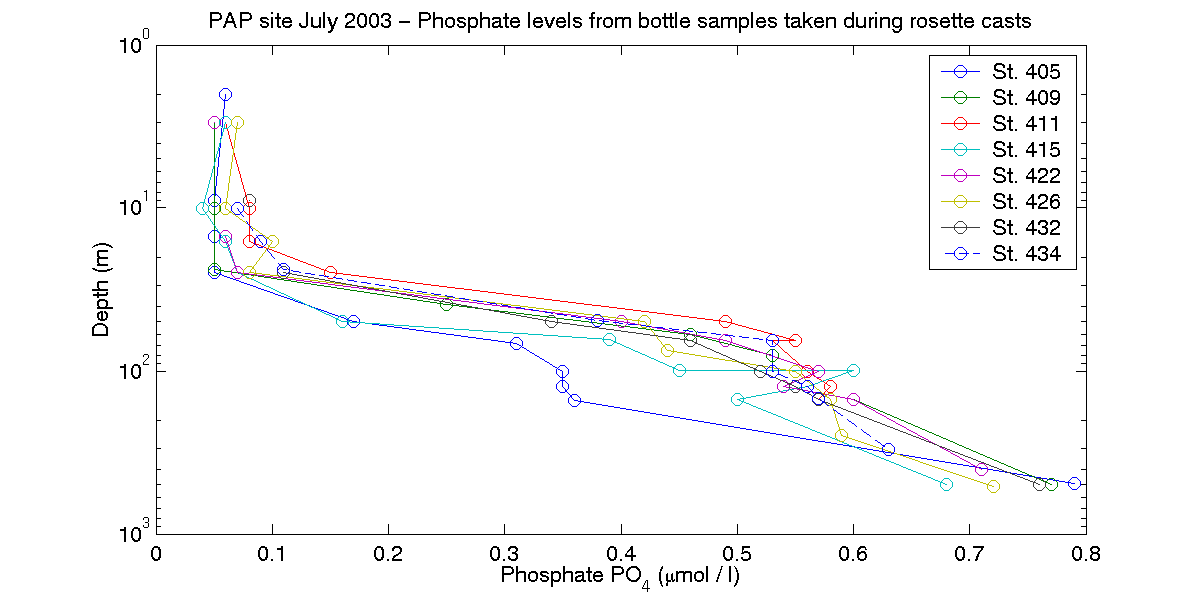
Phosphate Analysis
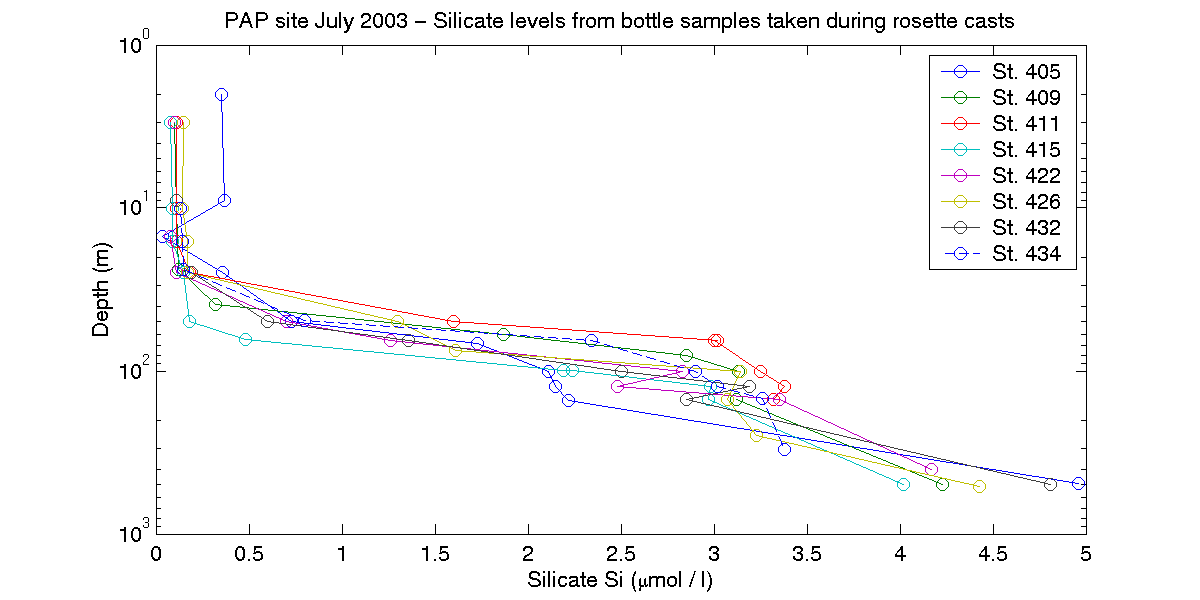
Silicate Analysis
Nutrient Analysis November 2003

Salinity Anaysis July 2003
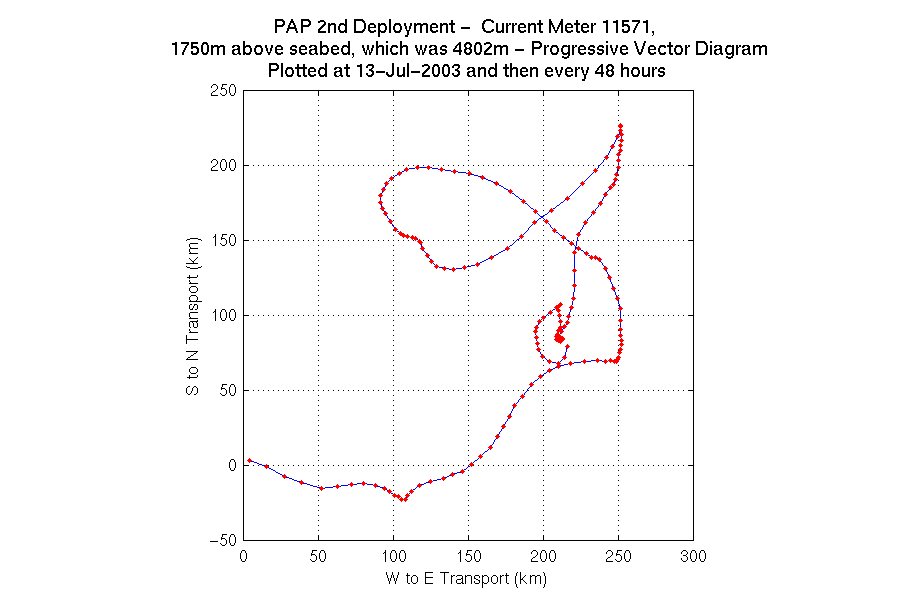
Current Meter 11571

Progressive Vectors
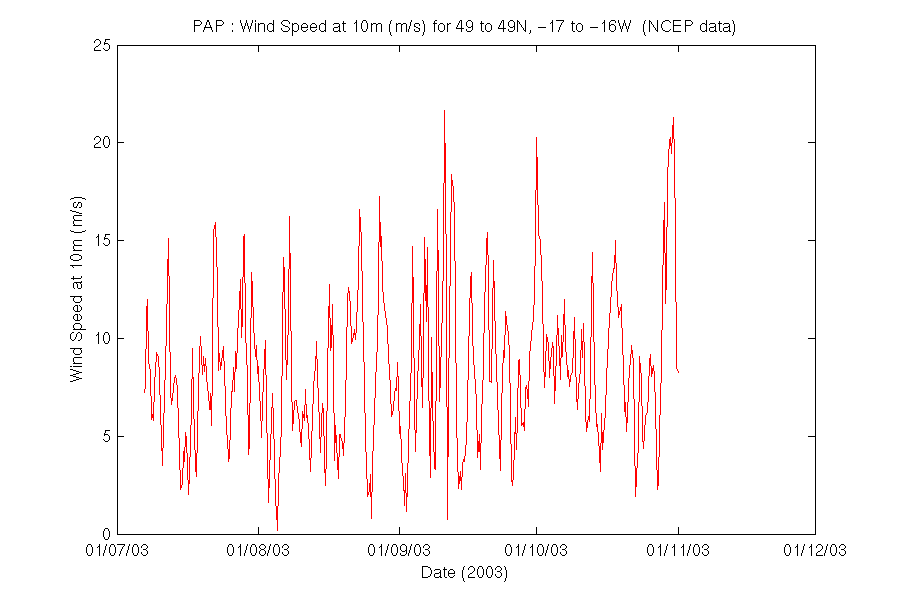
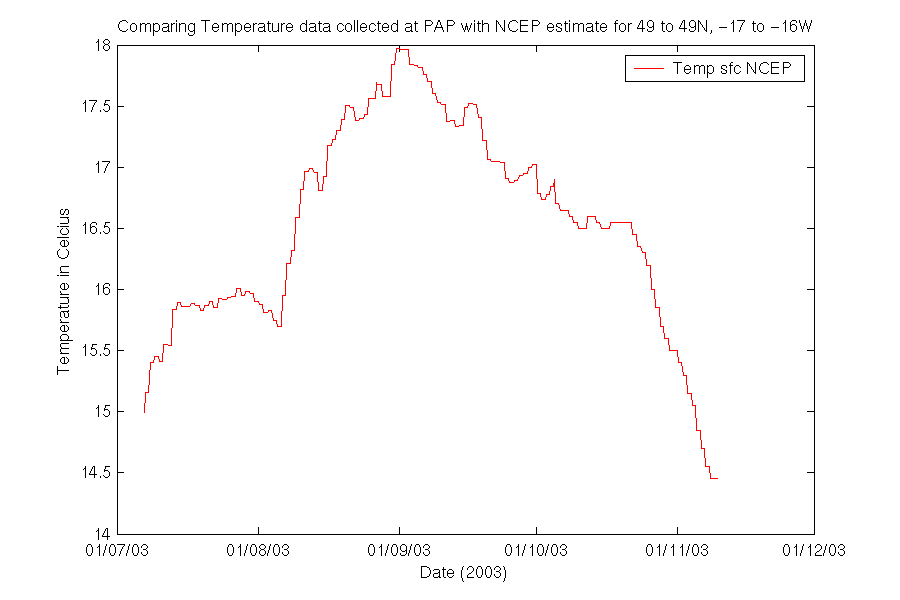
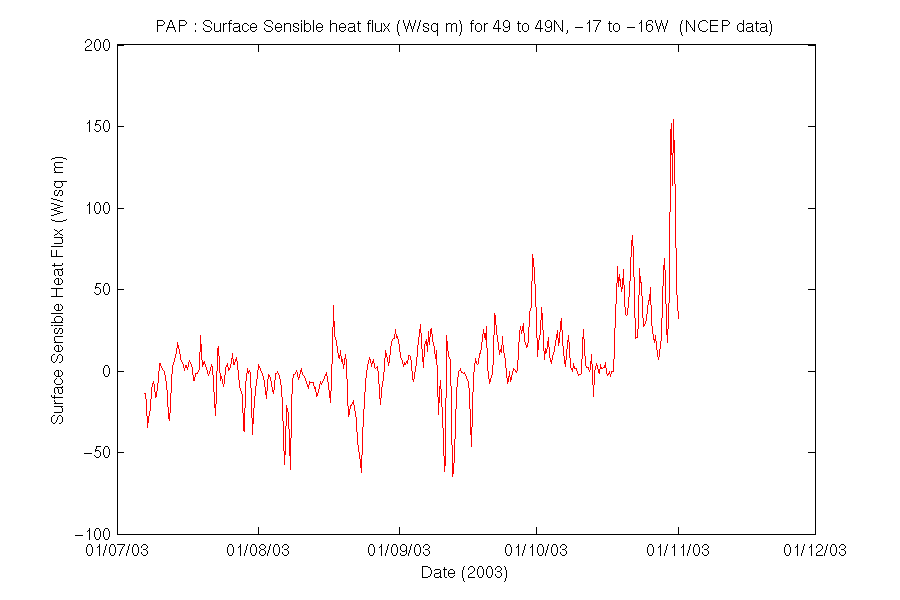
The NCEP/NCAR CDAS/Reanalysis Project makes a large amount of data available on the web, some of which are plotted here
Temperature (NCEP)
Surface Heat Flux (NCEP)
Wind at 10m (NCEP)