The graphs below were generated in near-real time from data transmitted via satellite from the PAP-1 buoy. Click on any image to see a larger version. These data have had some simple quality control measures applied in an attempt to remove spikes and invalid data. In some cases additional calibrations have been applied to the biogeochemical sensor data.
Other data were recorded aboard the mooring but were not transmitted in near-real time. After recovery, these data will be archived at the British Oceanographic Data Centre and can be accessed at: BODC PAP Collection. Please use the search term Porcupine or #5192 to find our data.
We are also starting to make these data available through the BODC ERDDAP service. To see the full time series, makes sure to set the 'start time' to the earliest possible date (by default only the latest data are shown).
Click here to view engineering graphs 
Instrument data telemetered from the PAP-1 buoy
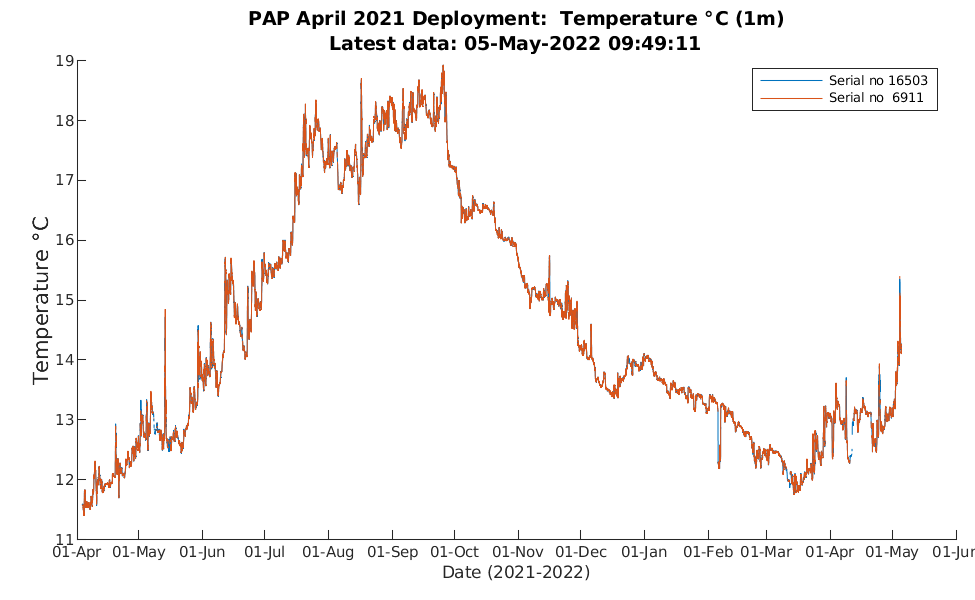
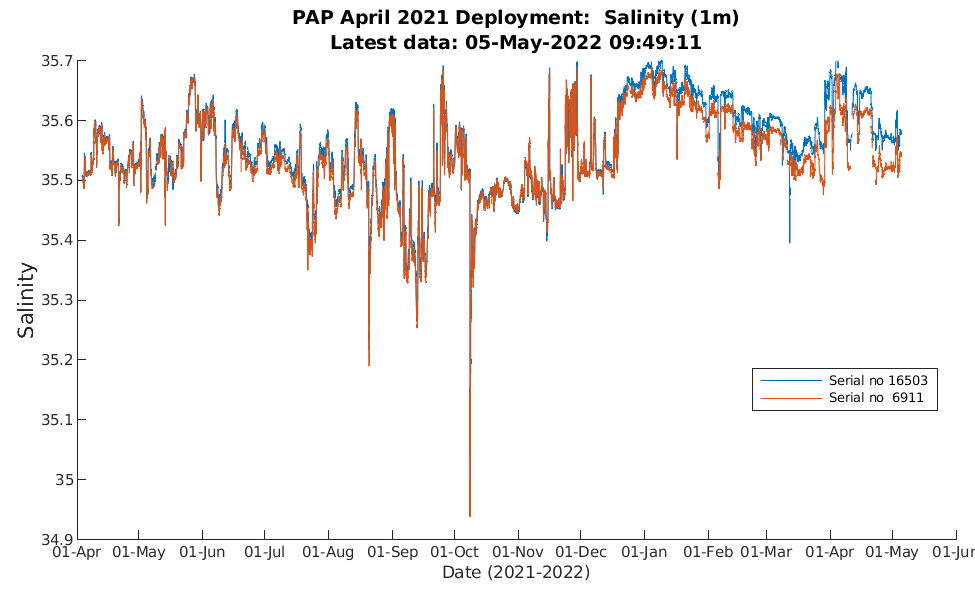
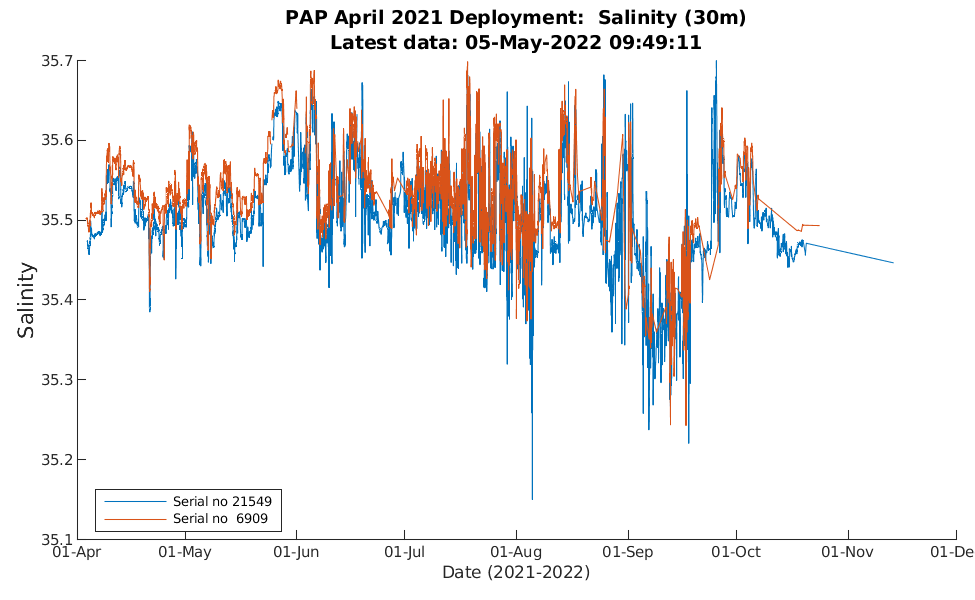
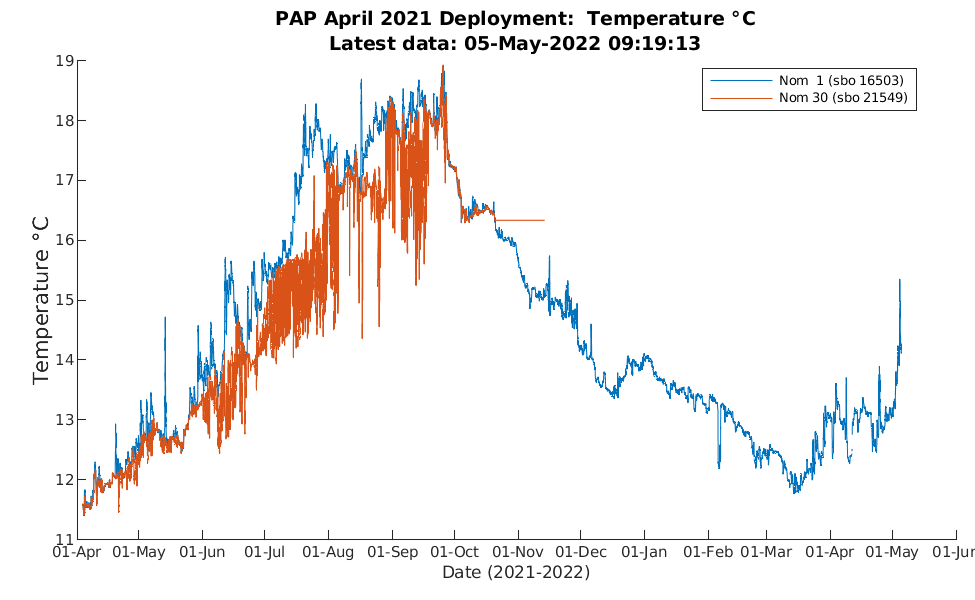
Temperature and Salinity
Surface Temperature
Surface Salinity
30m Temperature

30m Salinity
Temperature at 1m and 30m
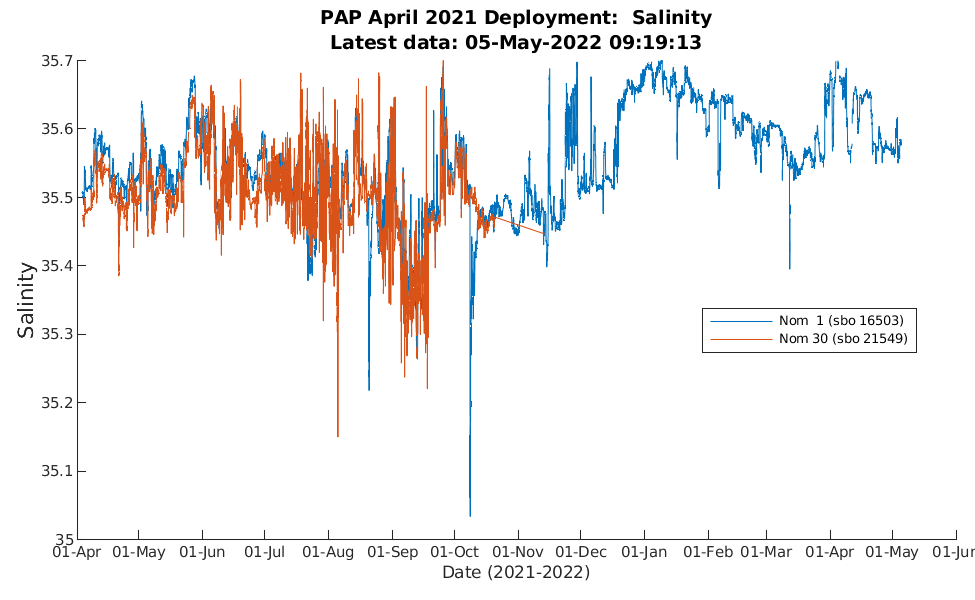
Salinity at 1m and 30m
Oxygen
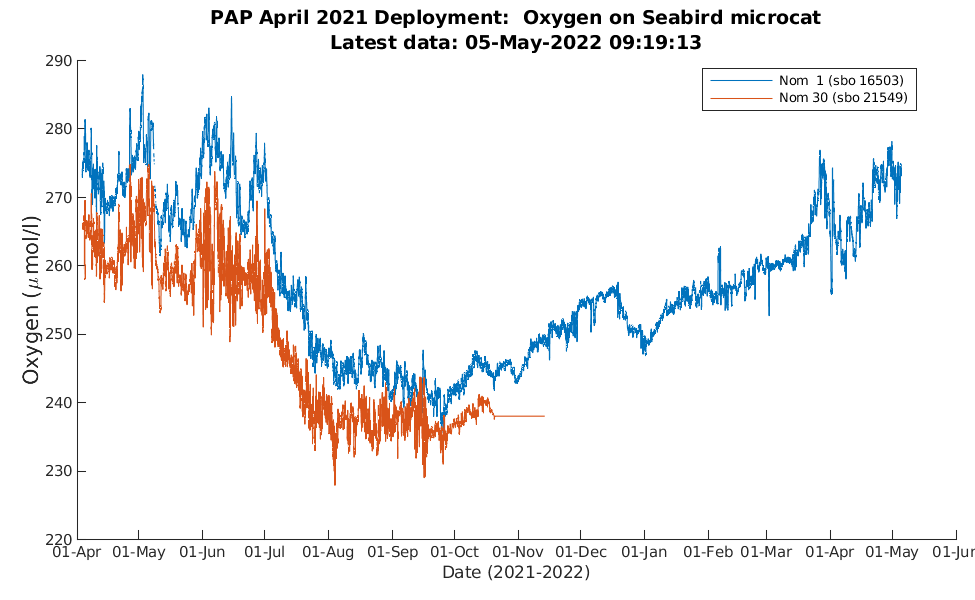
Oxygen at 1m and 30m (Seabird)
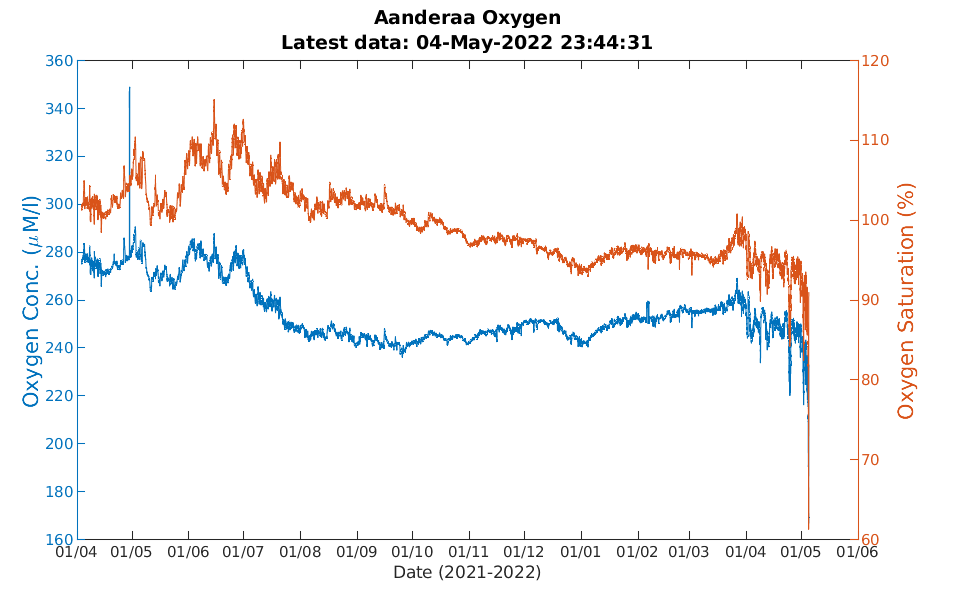
Oxygen at 1m (Aanderaa)
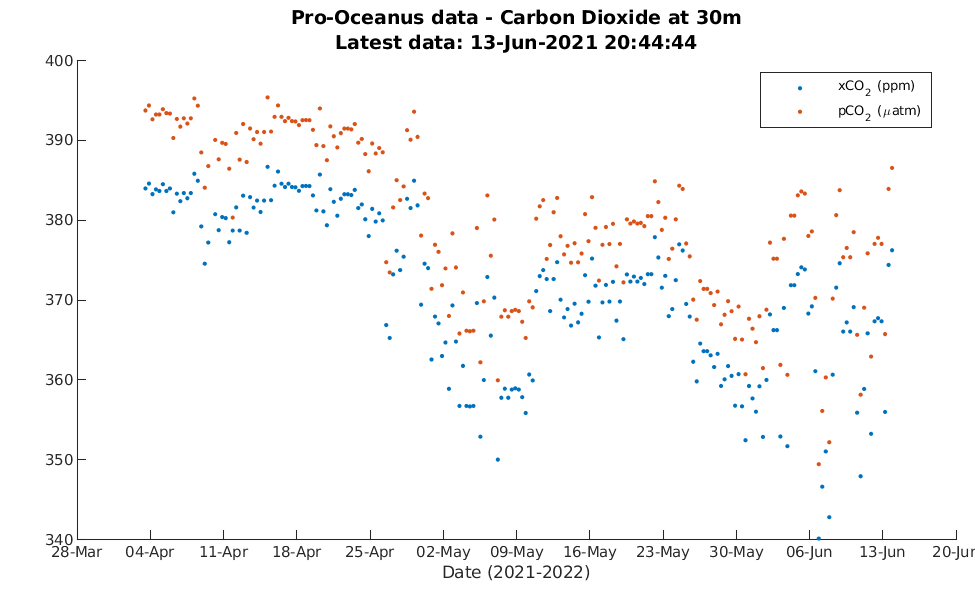
Carbon Dioxide
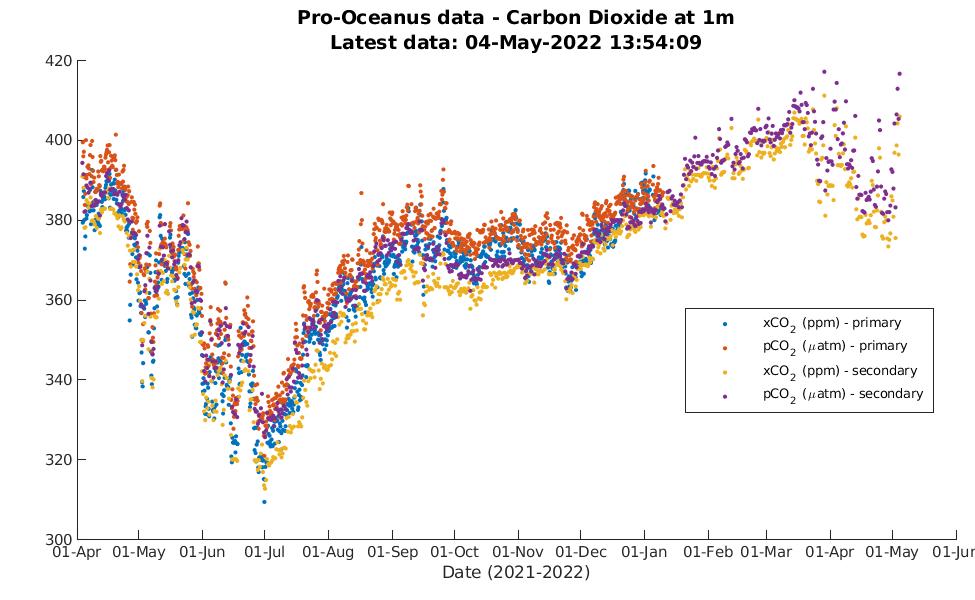
Carbon Dioxide at 1 m
Carbon Dioxide at 30 m
Carbon Dioxide in air

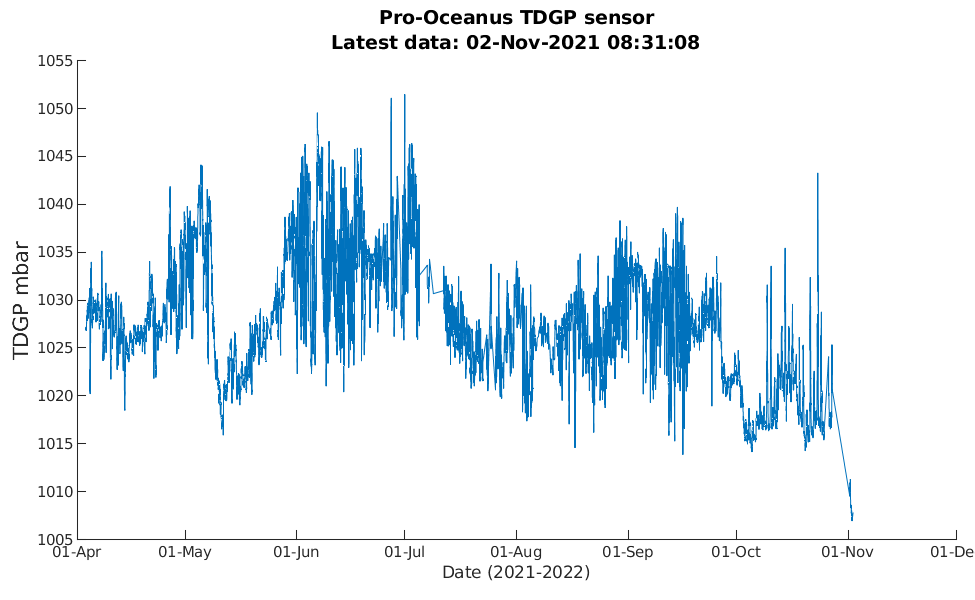
Pro-oceanus GTD-Pro at 30m
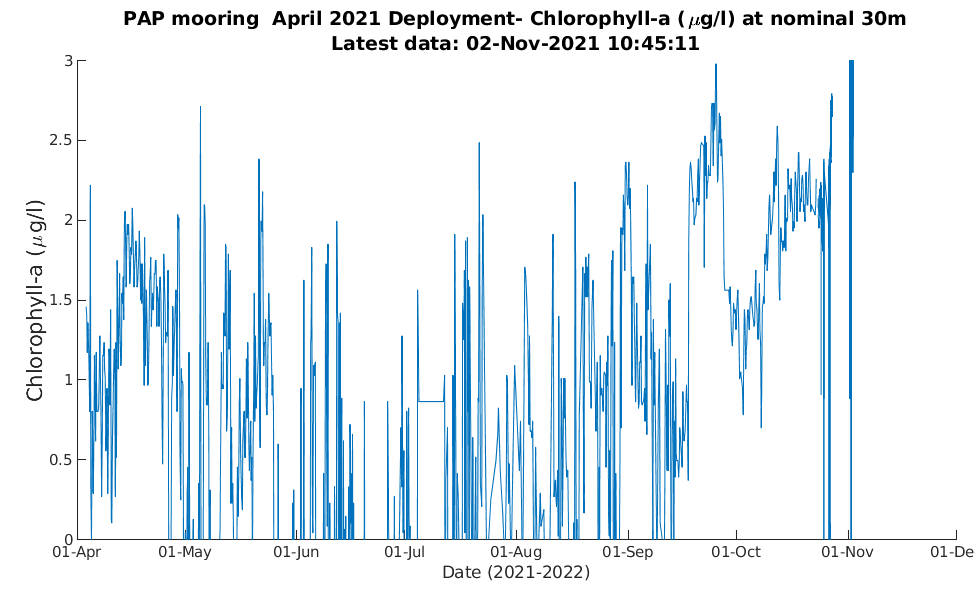
Chlorophyll-a
Chlorophyll-a at 30m (Wetlabs)
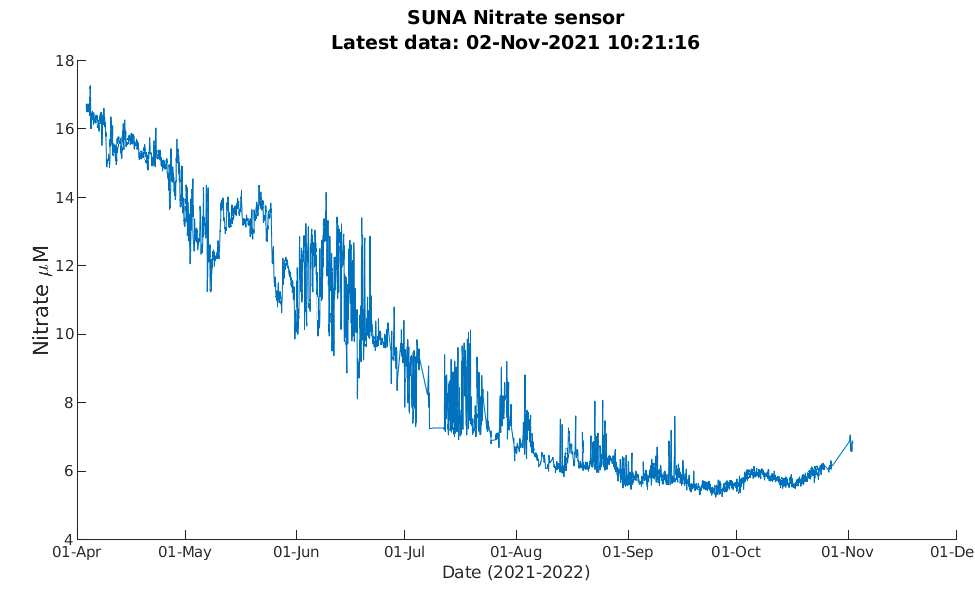
Nitrate
Nitrate at 30m (SUNA)
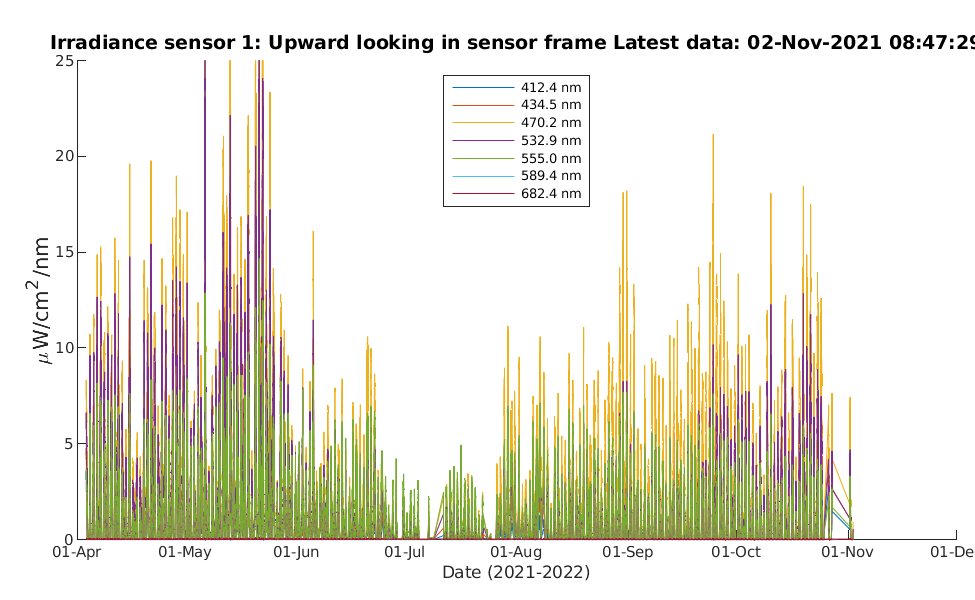
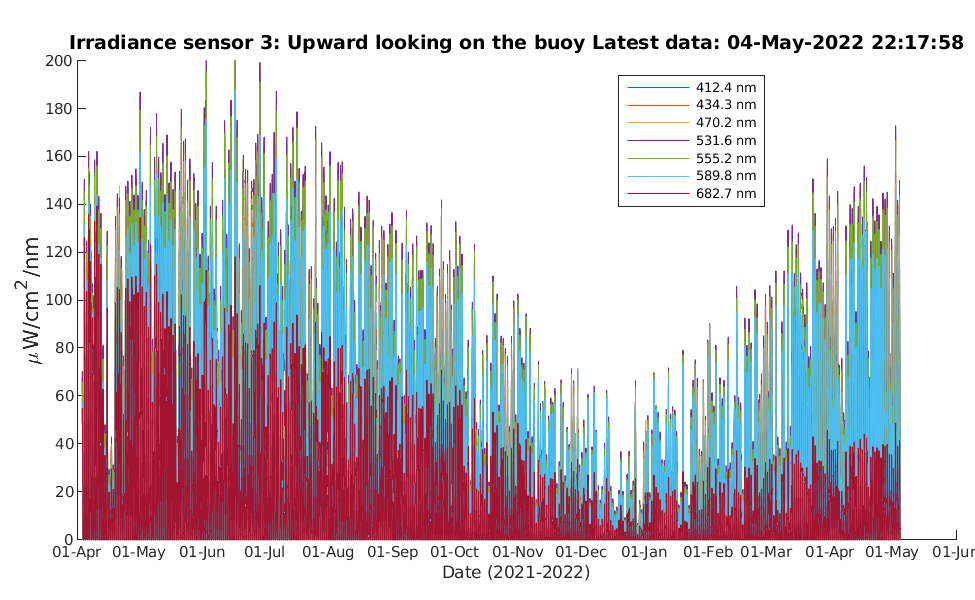
Surface Irradiance
Irradiance 1
Irradiance 3
MetOffice UK Meteorological Data
PAP is part of the MetOffice network of weather buoys, click here to view the full network.
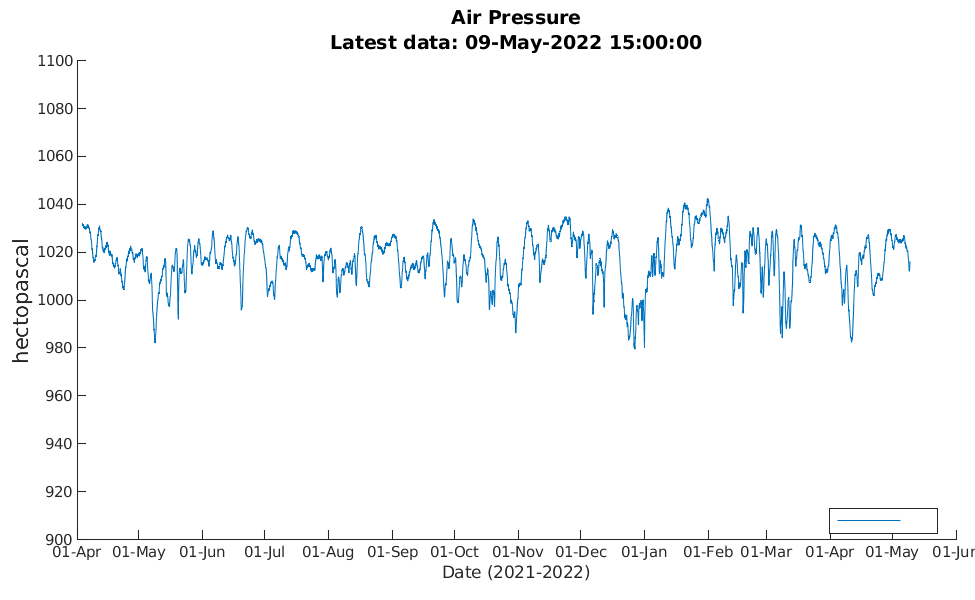
Air Pressure
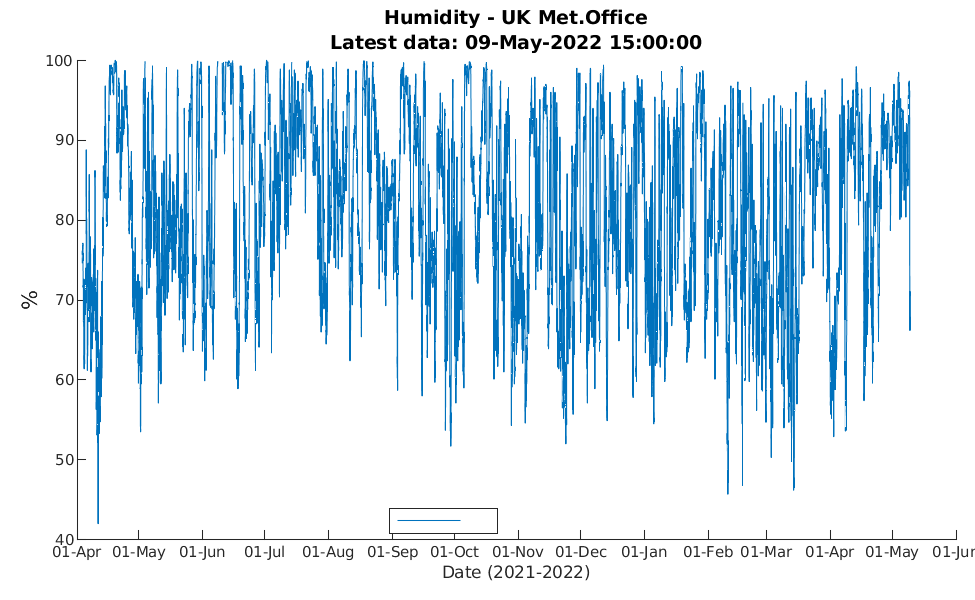
Humidity
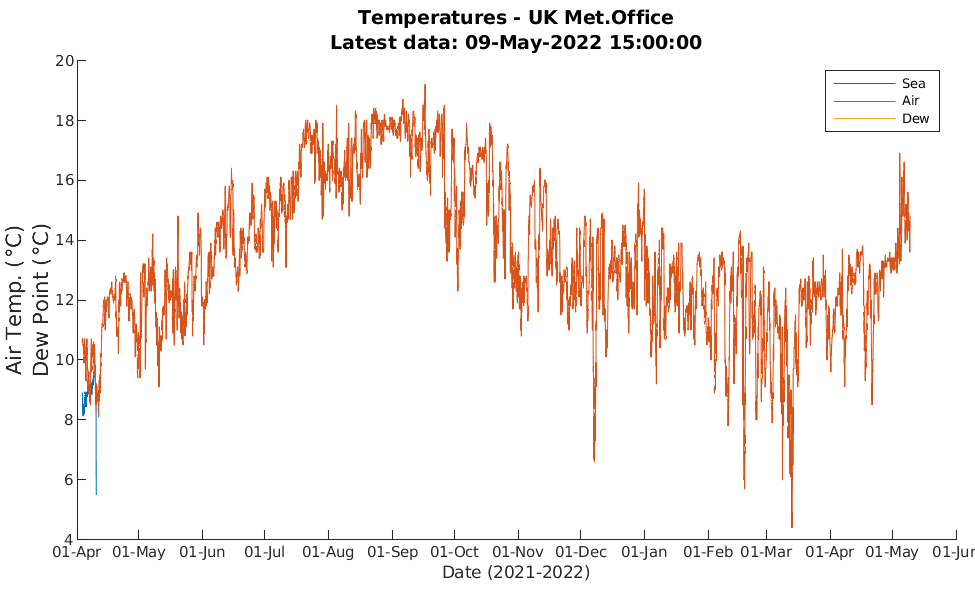
Temperatures
Wind Speed
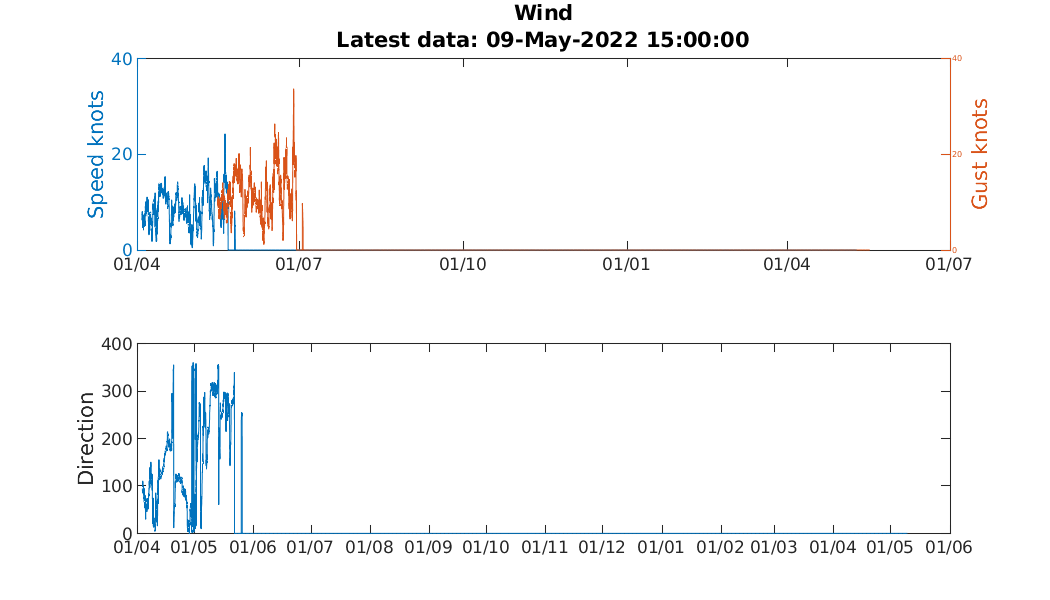
Wind Vectors
![]()
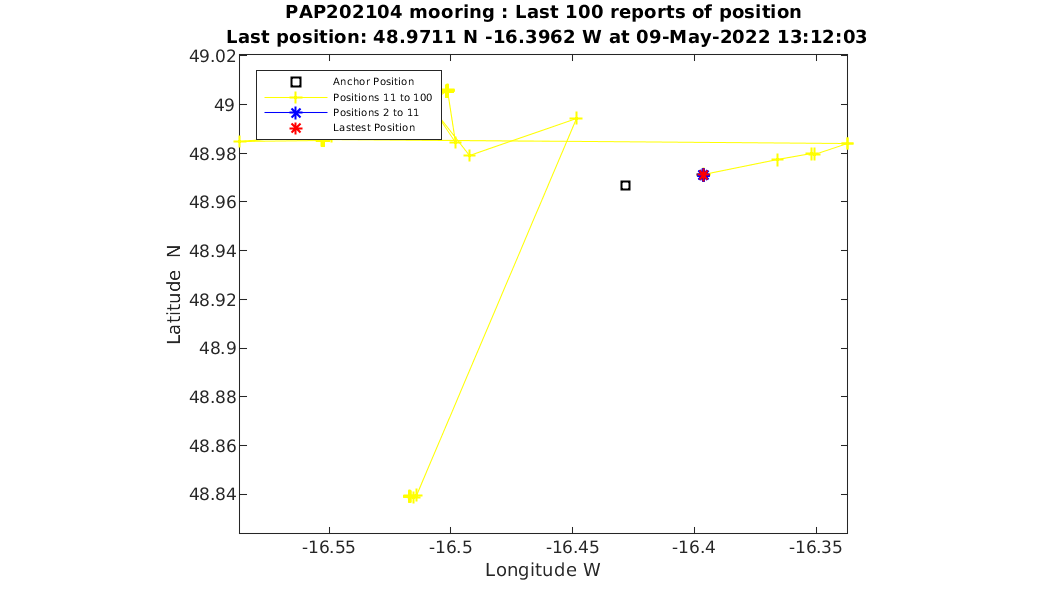
Mooring Position
Mooring Position
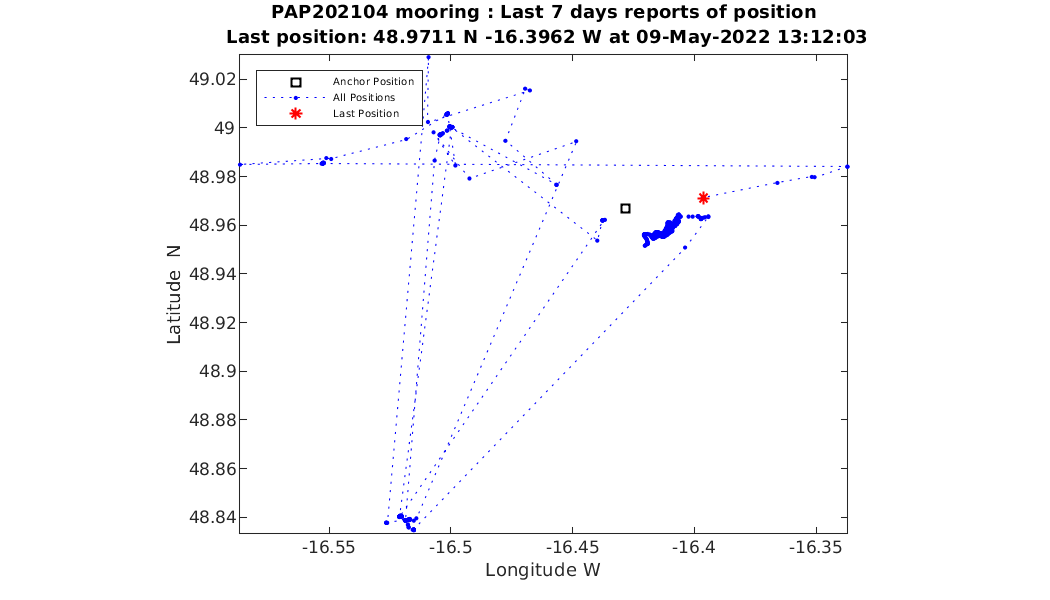
Last 7 days Track
Surface Pressure
Mooring Position from Met Iridium Transmitter

| PAP1 mooring | Contact at NOC |
|---|---|
| Biogeochemical sensors | Dr Sue Hartman |