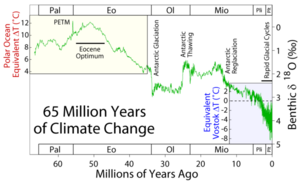
The Paleocene–Eocene Thermal Maximum (PETM) was a 'blip' in the smooth running of Earth's environment and climate that took place about 56 million years ago (see image to right). It is of great significance because it most probably represents the closest analogue to the changes being forced on the Earth at present by humanity. If we can work out what happened at the PETM, then it will most likely be very useful in helping us understand what is likely to happen in the future.
The PETM Event
Paleoclimatologists have collected large amounts of evidence about what happened at the PETM, both on land and also in the oceans. It seems clear that there was rapid and considerable global warming by ~5 °C. There is also evidence of ocean acidification, although this evidence needs to be carefully interpreted. Many species of benthic foraminifera went extinct. There was both rapid extinction and speciation (birth of new species) among mammals. There was a pronounced 'excursion' (temporary shift) to more negative δ13C values in ocean sediments. This is in addition to the temporary shift in δ18O shift shown in the right-hand image.
What Triggered the PETM?
A first question is what caused the PETM? A whole raft of hypotheses have been put forward, but out of these there are two main candidates that most people currently favour. The first of these suggests that it was a release of biogenic methane from methane clathrates on the seafloor that caused the global warming (Dickens et al, 1997). The second of these also invokes an input of methane, but this time of thermogenic methane (Svensen et al, 2004). The two different carbon sources have different characteristic δ13C values.
You can use the carbon model to explore some aspects of this event. The model does not separately represent methane in either the ocean or the atmosphere, but methane has a short lifespan in the oceans and the atmosphere due to rapid conversion to CO2. The model assumes that all methane is instantaneously oxidised to CO2, which may introduce a slight underestimation of its heating effects (methane is a more potent greenhouse gas, molecule-for-molecule, than is carbon dioxide).
Launch the carbon model and then click on 'Pulse Input' to add a pulse of carbon to the deep ocean, spread evenly over a period of 10,000 years. First experiment with adding pulses of biogenic methane. How much biogenic methane has to be added in order to get atmospheric pCO2 to rise to a maximum value of ?? ppm? (which should roughly correspond to 5 °C of global warming). Work out this number by trial-and-error with the model. Does it matter where the methane is added to? (surface ocean, atmosphere, deep ocean). How large is the maximum change in δ13C? How much does the average ocean lysocline depth change by, for addition of this quantity of biogenic methane?
Now repeat the experiment but this time adding thermogenic rather than biogenic methane. This has the same amount of carbon in it (you don't need to repeat the iterative process to work out how much methane to add), and therefore has the same impact on global warming and ocean acidification. But its δ13C is different - how large is the maximum change in δ13C this time?
If the maximum global warming was 5 °C, the maximum change in global average lysocline depth was 2 km, and the maximum change in δ13C of benthic foraminifera was ?? per mil, then which of the two methane sources seems to fit best with the observationsm according to the model results?
This exercise shows how we can get an idea of the process that initiated the PETM. In reality, however, at the present time we are limited in the data that is available to constrain these three parameters of global change. The change in δ13C of benthic foraminifera is the number that is most well known; the magnitude of global warming is also reasonably well-constrained, but the change in global average lysocline depth is less well determined. We know that it shallowed by at least 2km in the South Atlantic (Zachos et al, 2005), but to accurately constrain this number requires a depth transect of ocean cores - an enormous amount of work. We do not have equivalent data from other ocean basins.
How did the Earth System Recover from the Carbon Injection?
Current theory predicts two main responses to the carbon injection and ocean acidification at the PETM.
Carbonate Ion Recovery
The first predicted response is that carbonate compensation should return the saturation state (carbonate ion concentration) of the ocean back to pre-PETM levels over the course of about 10,000 years.
Launch the carbon model and apply an instantaneous carbon input of 4000 Gt C of thermogenic methane. Then alter the run duration to 20,000 years and run the model. Look at the resulting output plot for carbonate ion in the deep box and observe how the value of the variable in the model converges back towards the starting (pre-PETM) value. On the main window for the model, click on 'Save Simulation' and then import the saved data file into an analysis package such as Excel. Use this saved data to calculate the "e-folding response time" for the carbonate ion recovery. Using the saved data again, calculate the time that it takes for the deep box carbonate ion concentration to recover 90% of the way back towards its equilibrium value.
How does this predicted speed of recovery compare to the time that it takes for CaCO3 MAR (mass accumulation rates) and lysocline depth to recover in the South Atlantic (Zachos et al., 2005)?
Left-Over CO2 and Global Warming
A second aspect of the predicted response is that any injection of CO2 should leave behind a long-lasting (hundreds of thousands of years) residual of elevated CO2 and global warming. This is described for the present-day and fossil fuels on the page describing the long-term legacy of elevated CO2.
Run the carbon model as above, but with a run duration of 50,000 years (this will take some time to complete). Compare the trajectories of carbonate ion and of atmospheric CO2. By the time that carbonate ion has returned 90% of the way back towards its initial value, how close is atmospheric CO2 to its initial value? After 50,000 years how close are they both?
How does the model prediction of prolonged atmospheric CO2 and global warming compare to data, if δ18O is assumed to be a reliable indicator of surface ocean (and therefore Earth surface) temperature?
Overview
The exercises above give an introduction to some of the main questions that paleo researchers are targetting at the present time. The carbon model you have just used is not ideal for simulating the PETM, however, in the sense that it has no horizontal resolution and hence cannot reproduce geographical changes, whereas the data suggest that ocean circulation patterns changed during the PETM excursion and that this affected the palaeo records (Nunes & Norris, 2006; Zeebe & Zachos, 2007). For this same reason (changes in circulation affecting local records), we do not yet have a global picture of how the planet changed at the PETM. For instance, we only have detailed knowledge of the change in lysocline depth at one site, in the South Atlantic, but data at other sites suggests that the lysocline changes were not uniform across the globe (Zeebe & Zachos, 2007). Much remains to be done in terms of building a more complete global picture of how the Earth changed at the PETM, but collection of more data and close comparison to model results will eventually give us the answer.
External links
Paleocene–Eocene Thermal Maximum, Wikipedia
Further Reading
Zachos, J.C. et al. (2005). Rapid Acidification of the Ocean During the Paleocene-Eocene Thermal Maximum. Science 308, 1611-1615.
Nunes, F. & Norris, R.D. (2006). Abrupt reversal in ocean overturning during the Palaeocene/Eocene warm period. Nature 439, 60-63.
Zeebe, R.E. & Zachos, J.C. (2007). Reversed deep-sea carbonate ion basin gradient during Paleocene-Eocene thermal maximum. Paleoceanography 22, PA3201, doi:10.1029/2006PA001395.
Svensen, H. et al. (2004). Release of methane from a volcanic basin as a mechanism for initial Eocene global warming. Nature 429, 542-545.