Sustained observations in Drake Passage
High-quality hydrographic measurements have been made on the SR1b line across Drake Passage in almost every summer since 1993/1994, enabling scientists to monitor changes and better understand the dynamics of the Southern Ocean.
People and Institutions
The work was initially led by scientists from the Institute of Oceanographic Sciences at Wormley, and more recently has been led by teams from the National Oceanography Centre (NOC) at Southampton. Many scientists and students from the NOC and other institutions, including NERC's British Antarctic Survey and the University of East Anglia, have taken part in the 26 cruises to date, including principal contributions from B. King, S. Alderson, S. Cunningham, M. Brandon, M. Meredith, S. Bacon, A. Williams, M. Sparrow, K. Stansfield, G. Quartly, H. Venables, M. Yelland, E. McDonagh, A. Watson, A. Meijers, and J.-B. Sallée.
Yvonne Firing is the current principal scientist for these measurements.
Cruises and Data
A list of cruises that have included occupations of SR1b is here, along with links to cruise reports and data. Each cruise is relatively short, typically around three weeks at sea rather than the six weeks more commonly required for a major hydrographic expedition. The SR1b section has often been combined with other work in the area, such as ACCLAIM and DIMES, as well as with logistics for research stations along the Antarctic Peninsula. Recent cruises are featured on our cruise blog.
In addition to establishing a unique time series of ocean measurements leading to interesting science results, the cruises have fostered collaboration between NERC institutes and Higher Education Institute groups, have provided many PhD students with an opportunity to experience deep-ocean physical oceanography fieldwork, and have been used to test and develop new measurement techniques.
If you are interested in participating one of the yearly Drake Passage hydrographic cruises, please contact Yvonne Firing.
Results
The twenty-four complete occupations of SR1b to date have enabled the scientific community to monitor interannual variability and trends in ACC transports of water and heat (below) as well as the properties and distribution of different water masses found in Drake Passage, and to study a range of oceanic processes and ocean-atmosphere interactions, from the role of eddies in turbulence and mixing, to modulation of the meridional overturning circulation. Data from SR1b have been used directly in numerous journal publications and theses, as well as being incorporated into ocean atlases.
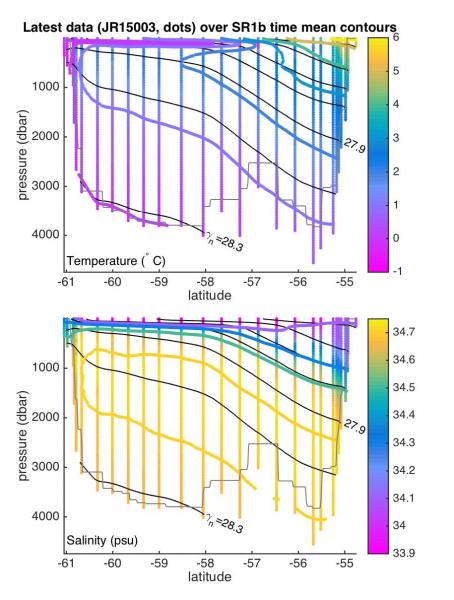
Annual occupations help us distinguish trends associated with changing forcing from variability due to the meandering ACC fronts. This latitude-depth plot compares temperature and salinity from the cruise in January 2016, JR15003, with the average temperature and salinity over all 21 occupations up to and including JR15003. In-situ temperature and calibrated salinity from stations sampled on JR15003 are plotted as coloured dots (merging into vertical lines). The time mean values are contoured (every 1oC and every 0.2 psu) with the same colour scale, while mean neutral density contours (isopycnals) are plotted in black (every 0.2, as labelled).
The surface temperature minimum in the southern part of the passage is visible in the mean contours, as is the Circumpolar Deep Water salinity maximum at mid-depths. The time average smears out the Polar and Subantarctic Fronts, so that they appear as a single region of smoothly-sloping isopycnals between 58oS and the northern boundary. On JR15003, however, the Polar Front was well to the north of its mean position.
Transport through Drake Passage
The transport calculation is based on baroclinic geostrophic velocity, which is the component of the flow due to horizontal gradients in density in a rotating system (like the earth). We use measurements of temperature and salinity to compute density; the density gradients between pairs of stations then give us the geostrophic shear.
For a single occupation, geostrophic shear can be converted to geostrophic baroclinic velocity by summing from ("referencing to") zero at the deepest common level shared by adjacent stations on that occupation (this method was used for the values in the cruise table). For comparing multiple occupations, which may have taken measurements to different depths at slightly different places along the section, we use a "time-series deepest common level", the shallowest of all occupations' deepest common levels at each point along the section (grey stepped line).
The resulting velocity profile is multiplied by the distance between stations to give the volume transport across the line between those stations, and the velocity field is then accumulated across the section to give an estimate of the total transport for each year that the section was occupied. Total volume transport is measured in units of a million cubic metres per second, or Sverdrups (Sv).
![]()
One reason we have sustained measurements in Drake Passage is that we are interested in the exchange of heat (and other properties) between the Pacific and Atlantic Basins. For this purpose, we use the transport-weighted average temperature: for each cruise, we multiply the mean temperature in a small grid box by the volume transport through that grid box, sum, and divide by the total volume transport.
Since we have made measurements in months from November to March, we are able to detect a seasonal variation. The four months' difference between the beginning of November (early southern spring) and the end of February (southern summer) account for 0.4°C in the average temperature of the water. It is important therefore to compensate for this effect (as in the cruise table) before looking for trends in the data.
There is no statistically significant trend in either volume or temperature transport between 1993-1994 and 2015-2016: in other words, even over two decades, any long-term trend in these quantities is too small to detect above the interannual and shorter-time-scale variability.
Although the total volume transport and mean temperature have remained stable during this series of observations, other properties and their transport have not. Some of the works listed in the publications section of this website analyse interannual to decadal changes in water properties in Drake Passage.