Cruise JC031 section plots
Section SR1: CFCs | Chemistry | CTD Sensor Measurements | Carbon
Section SR1B: CFCs | Chemistry | CTD Sensor Measurements | Carbon
The sections shown below have been plotted to correspond with each of the Drake Passage transects.
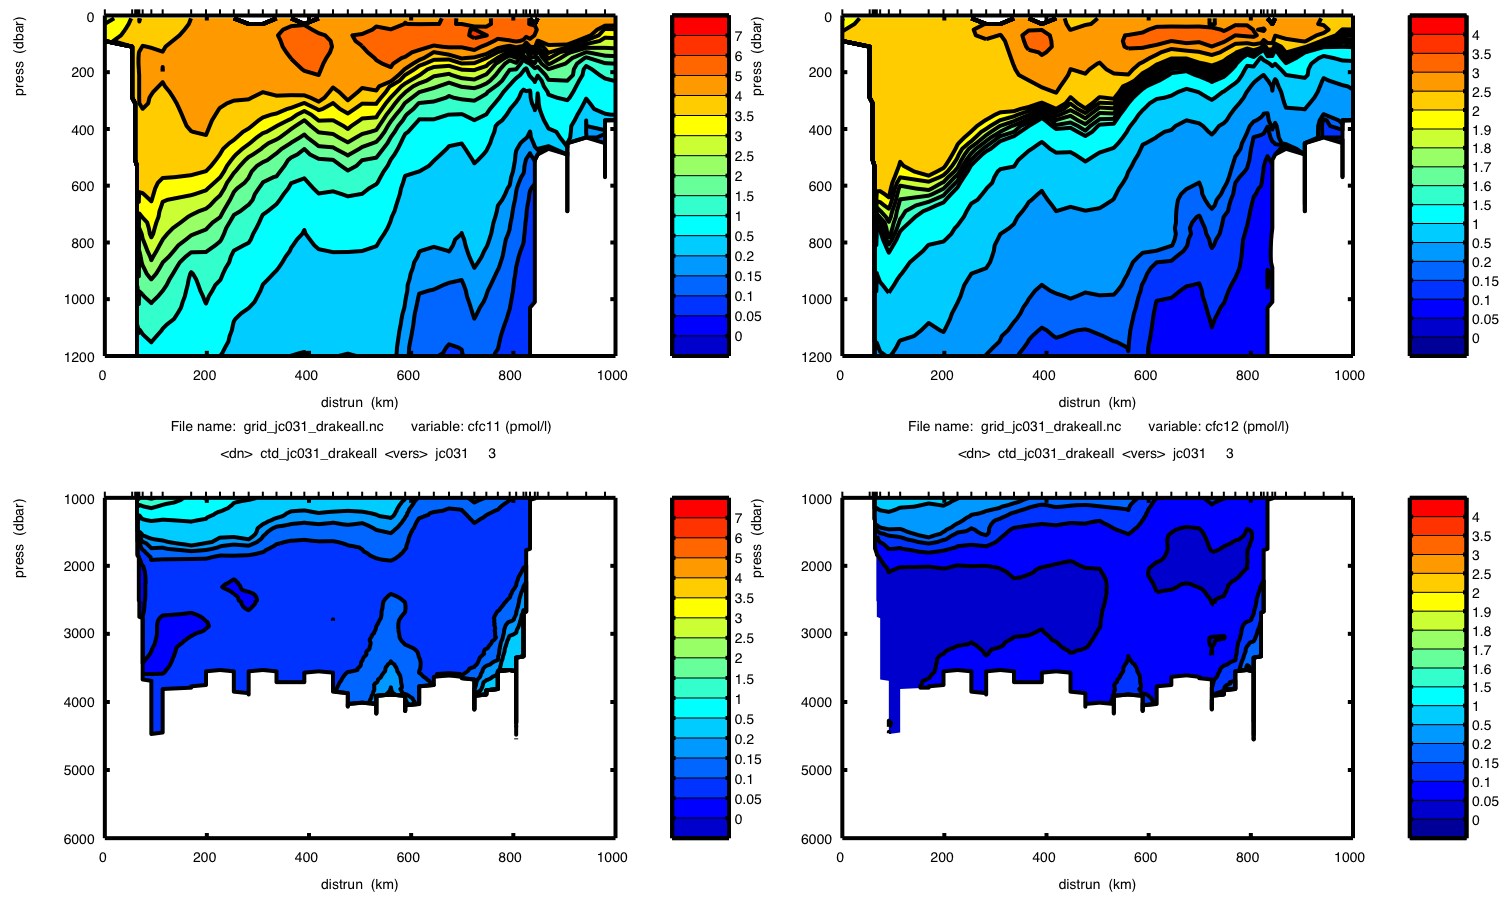
The y-axis of the section plots are divided into two parts: approximately the top 1000m (1000dbar) which is on a high resolution scale; and the remaining depth at a lower resolution. The plots are divided like this in order to show the greater concentration variations in the surface waters. Such high resolution at depths greater than 1000m is not usually required.
Section SR1
CFC11 (left) CFC12 (right)
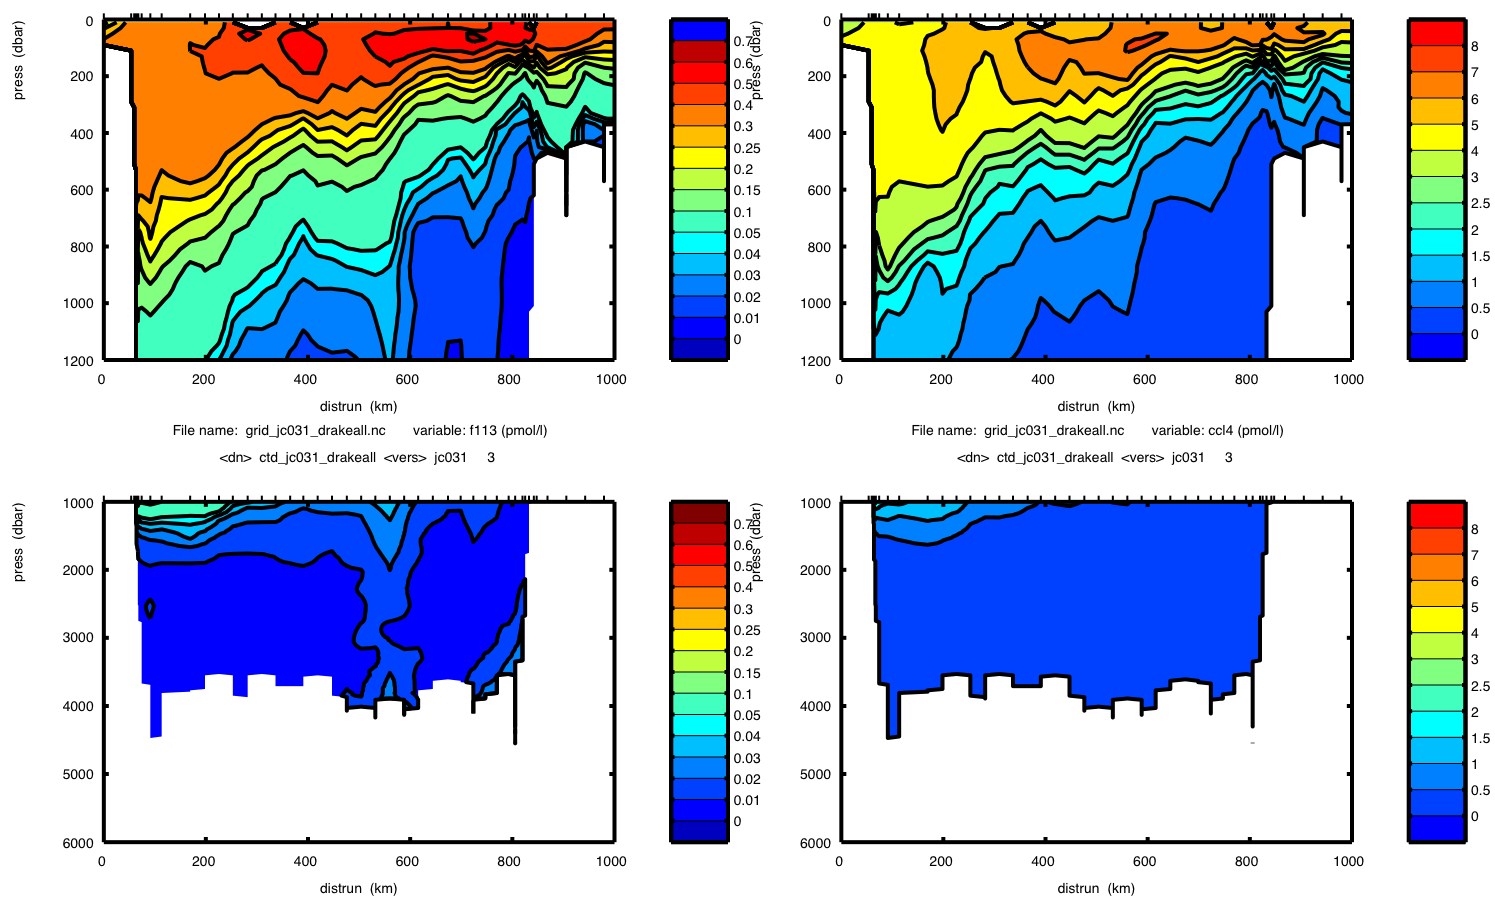
F113 (left) CCl4 (right)
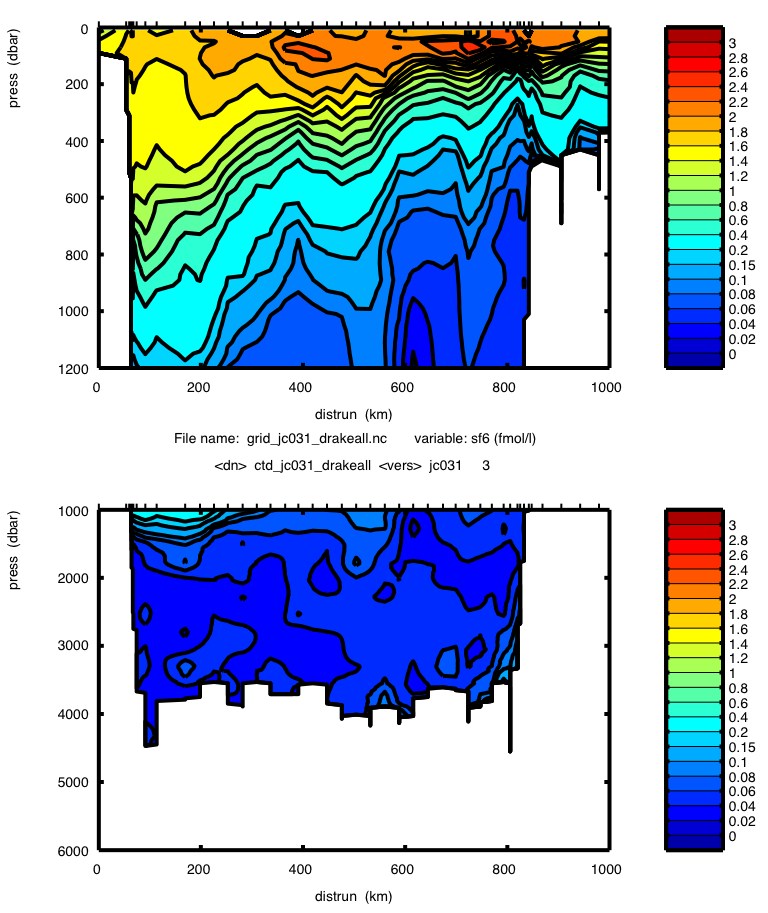
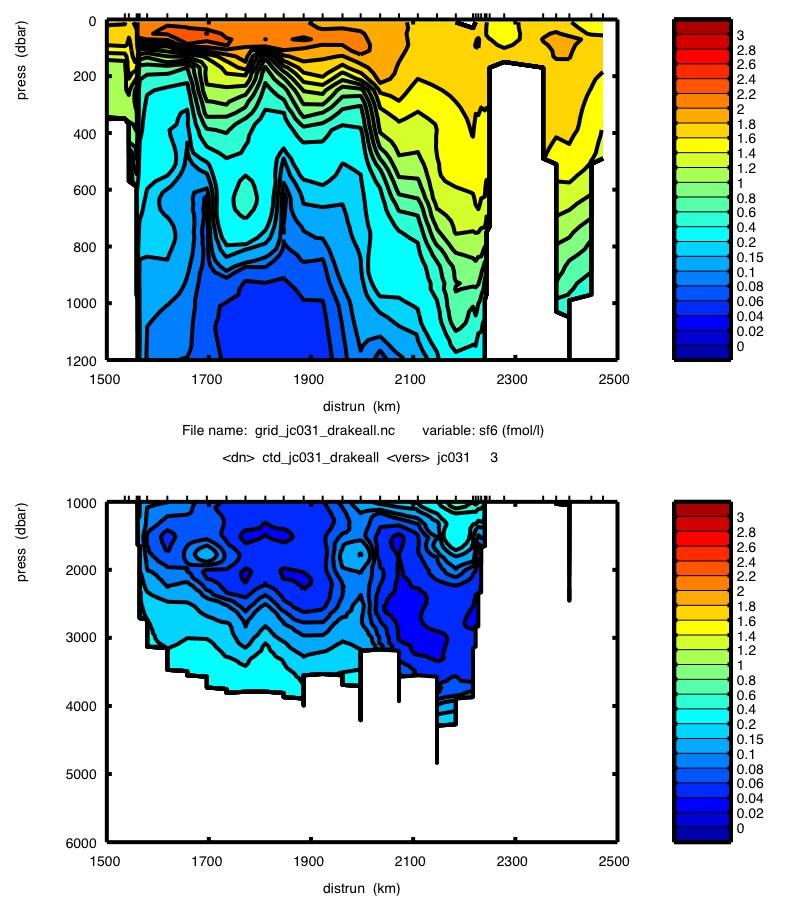
SF6
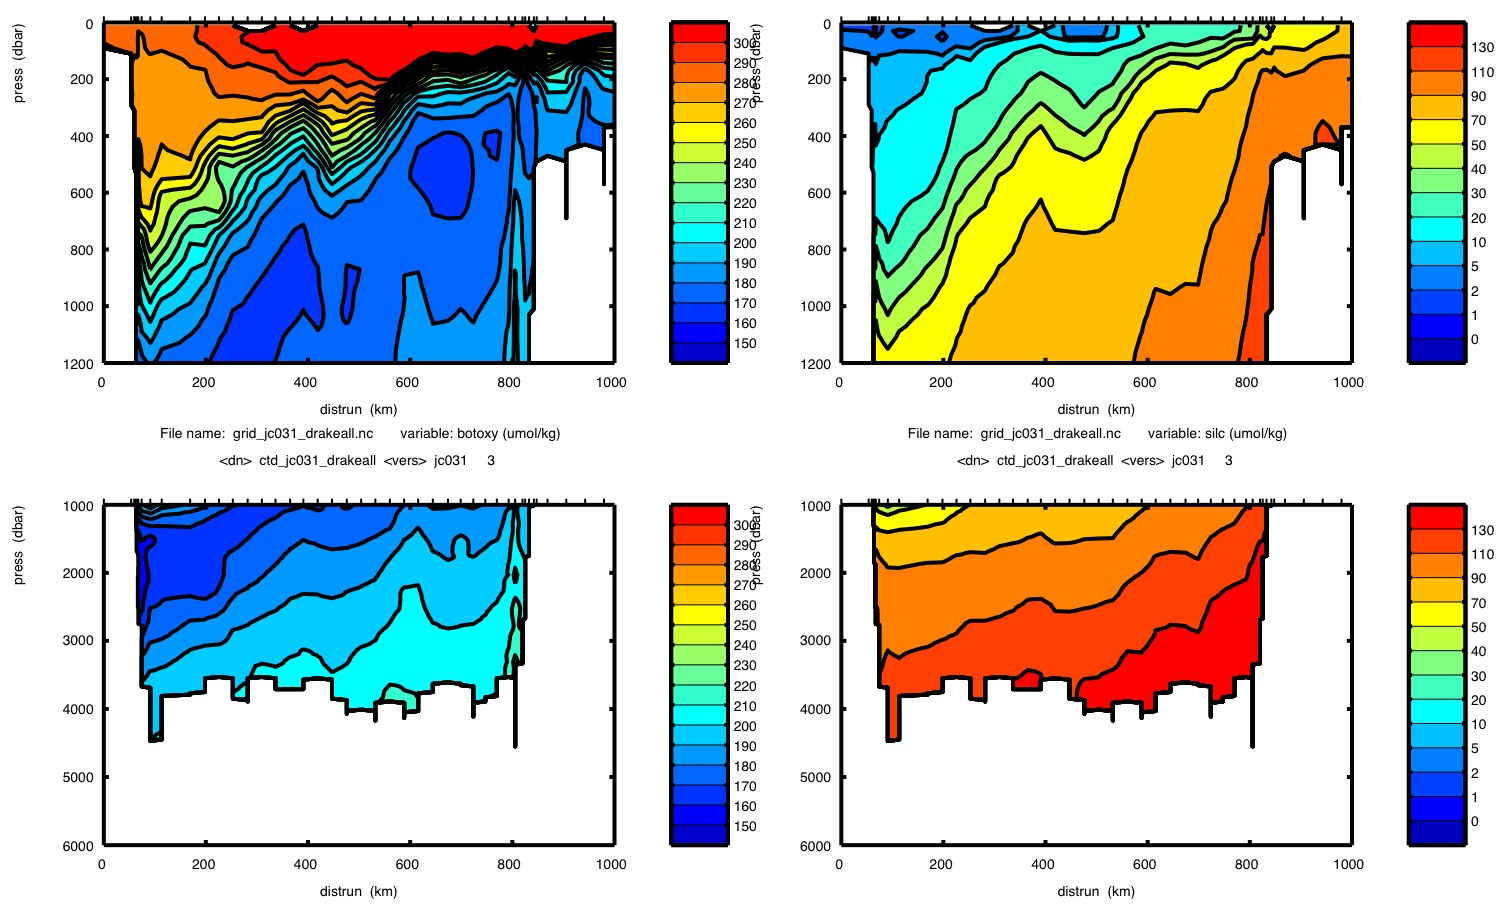
Bottle Oxygen (left) Silicate (right)
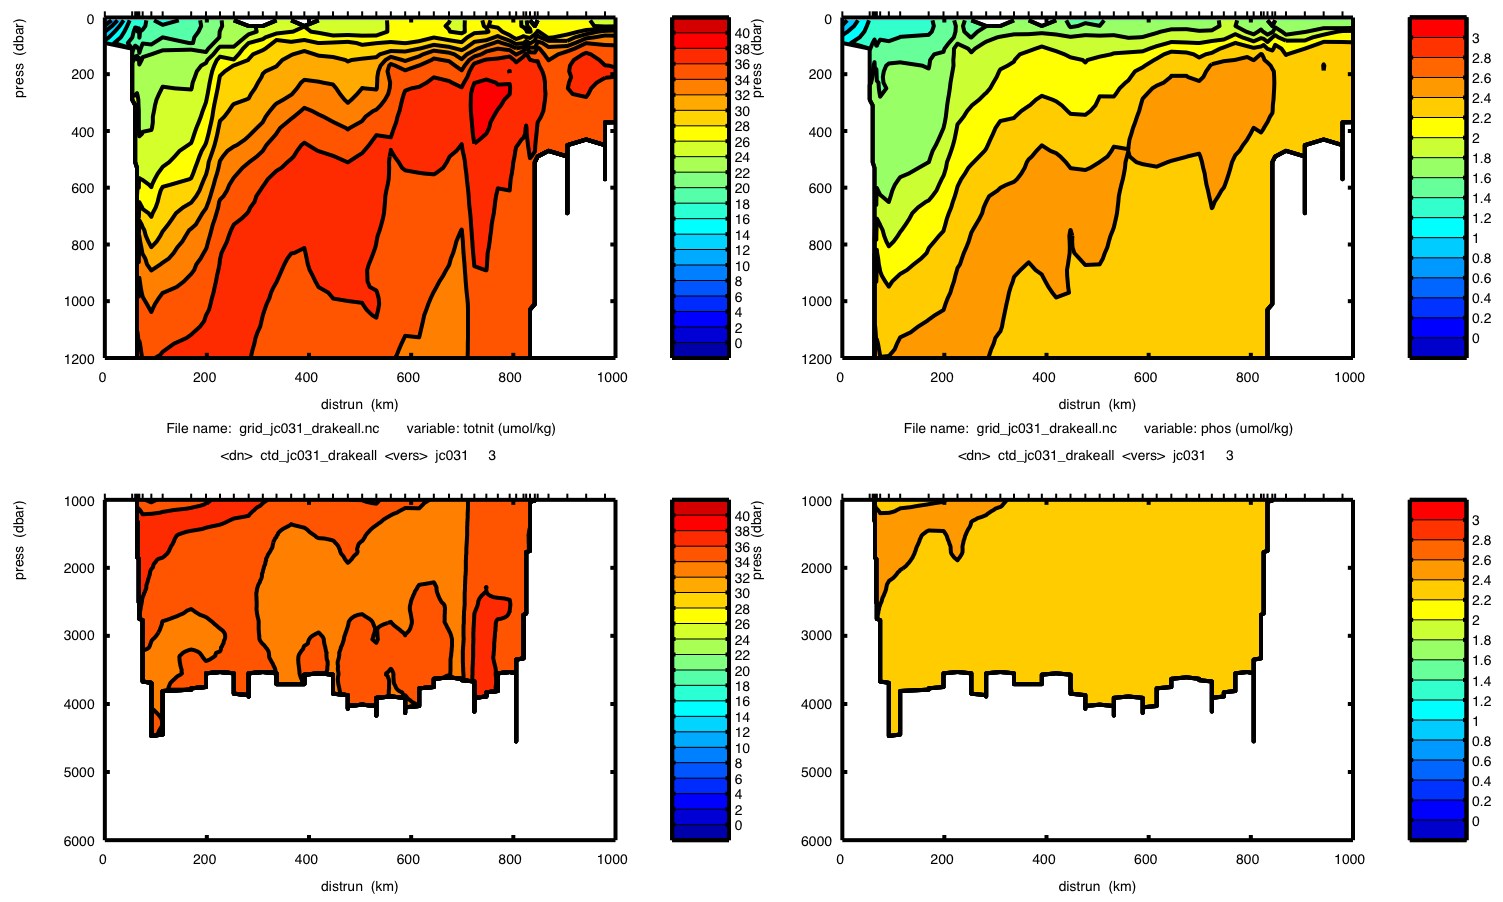
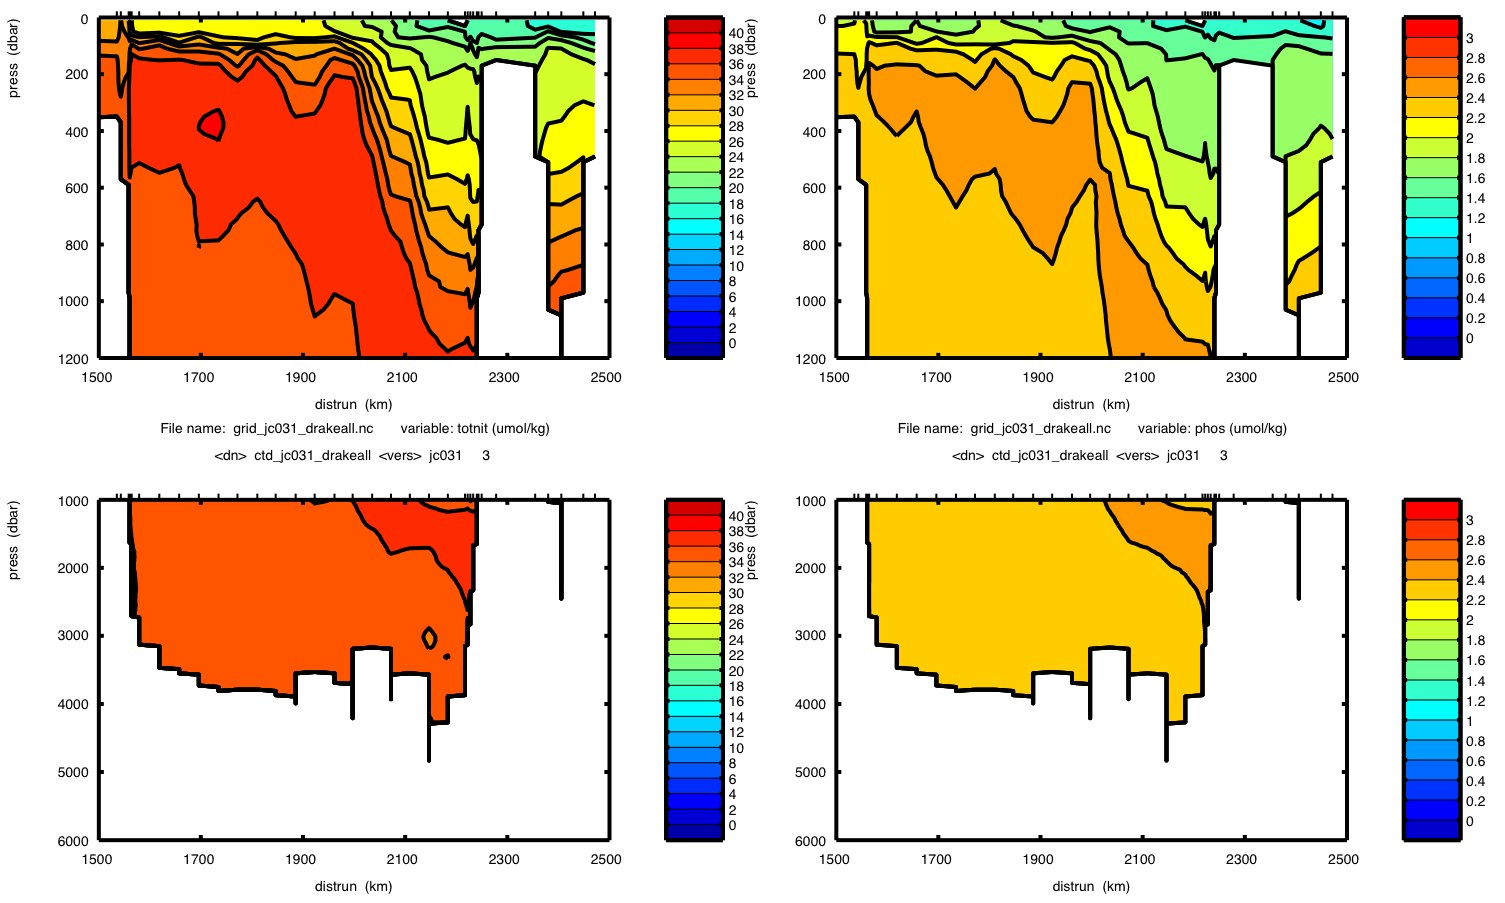
Total Nitrate (left) Phospate (right)
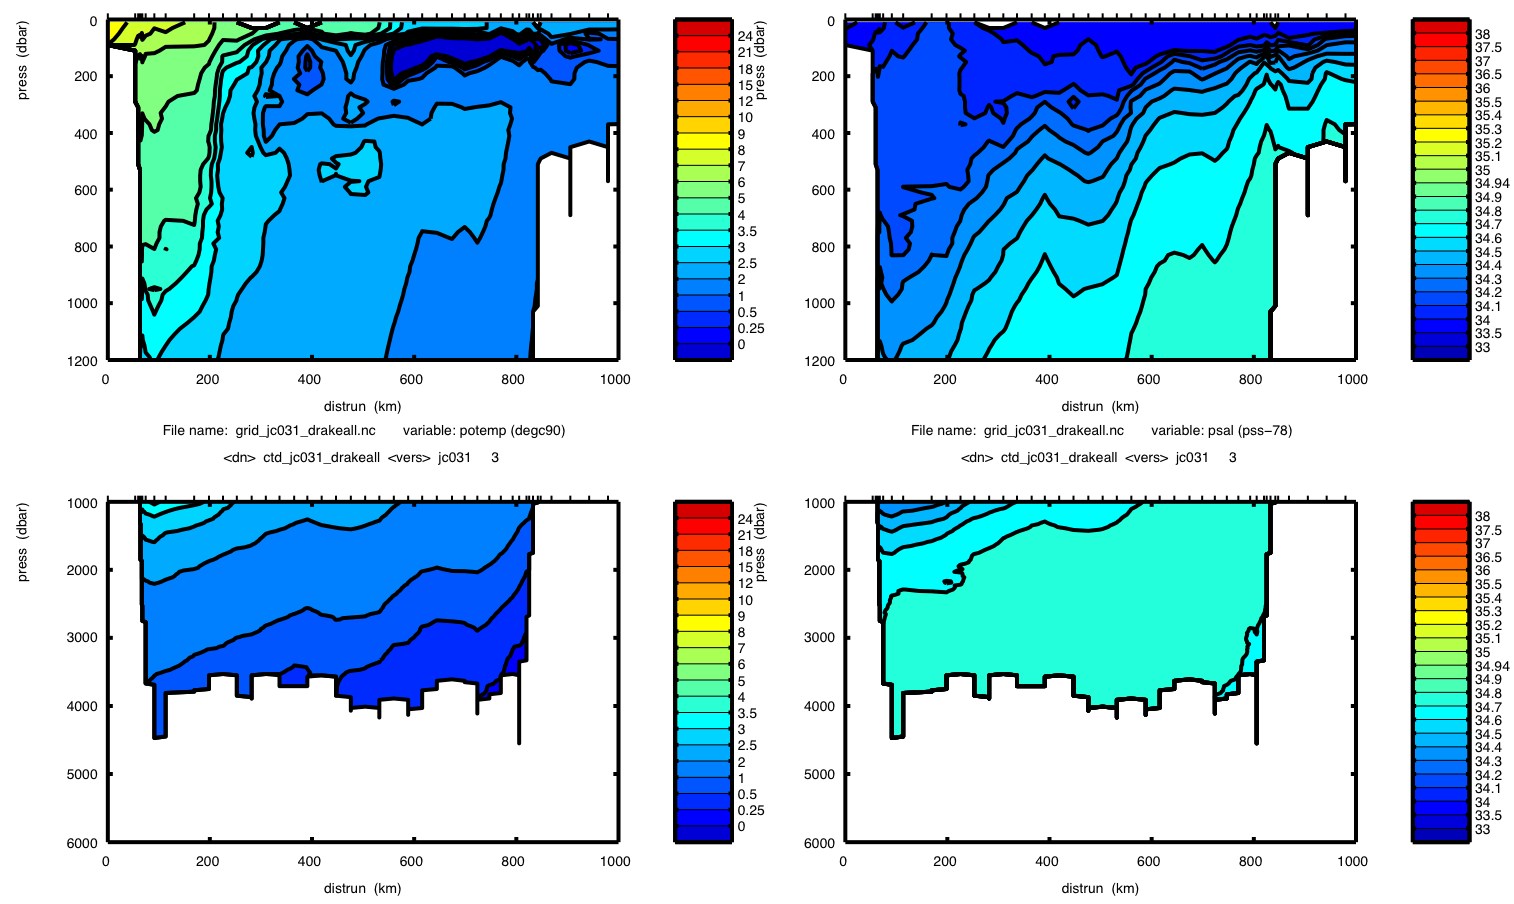
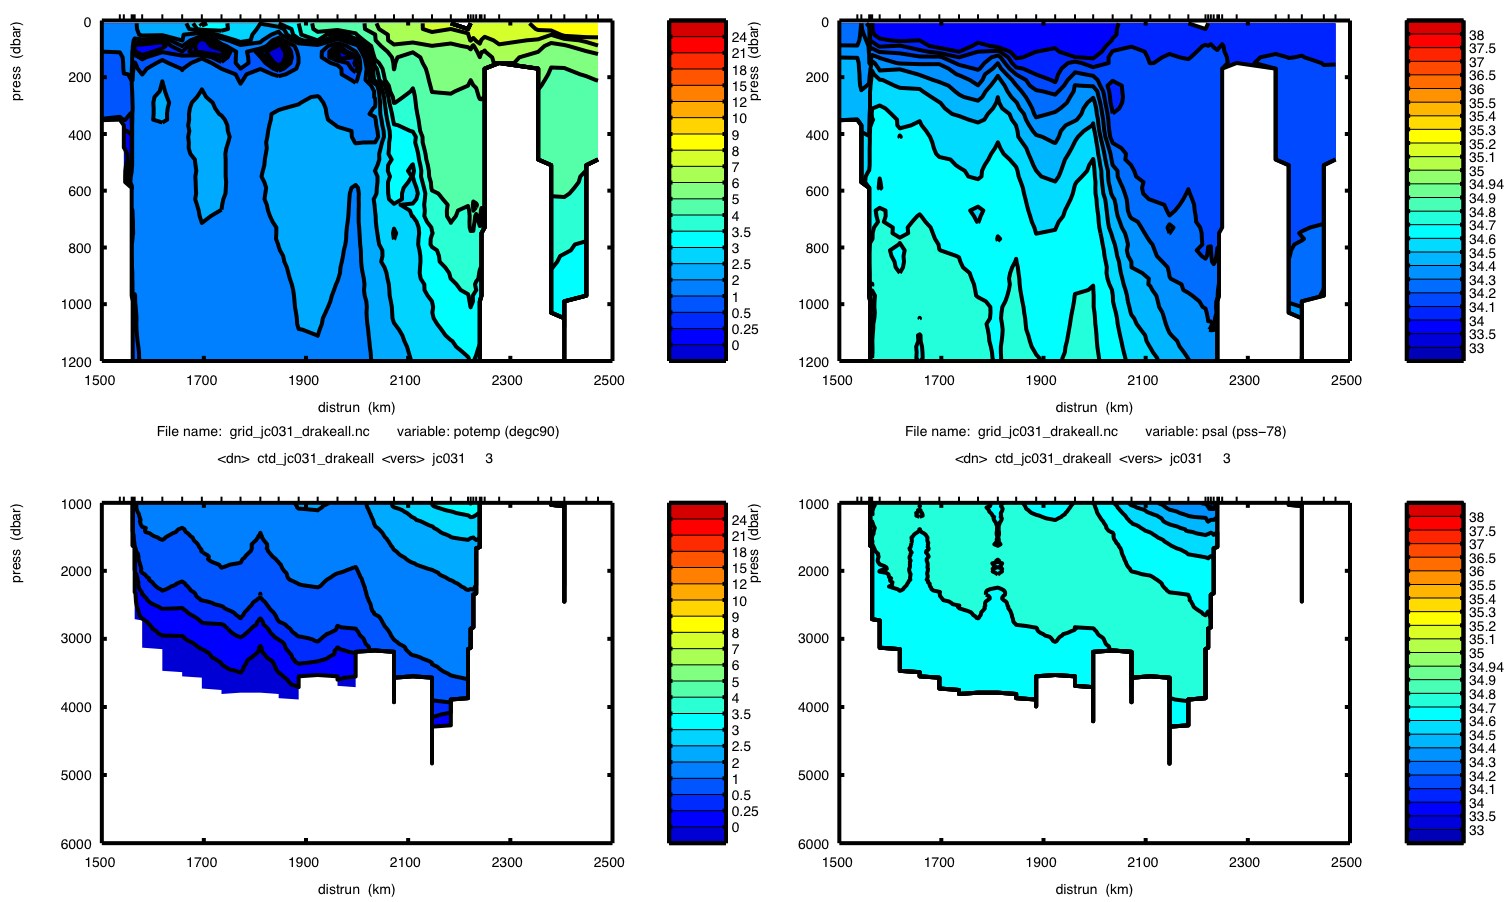
Potential Temperature (left) Salinity (right)
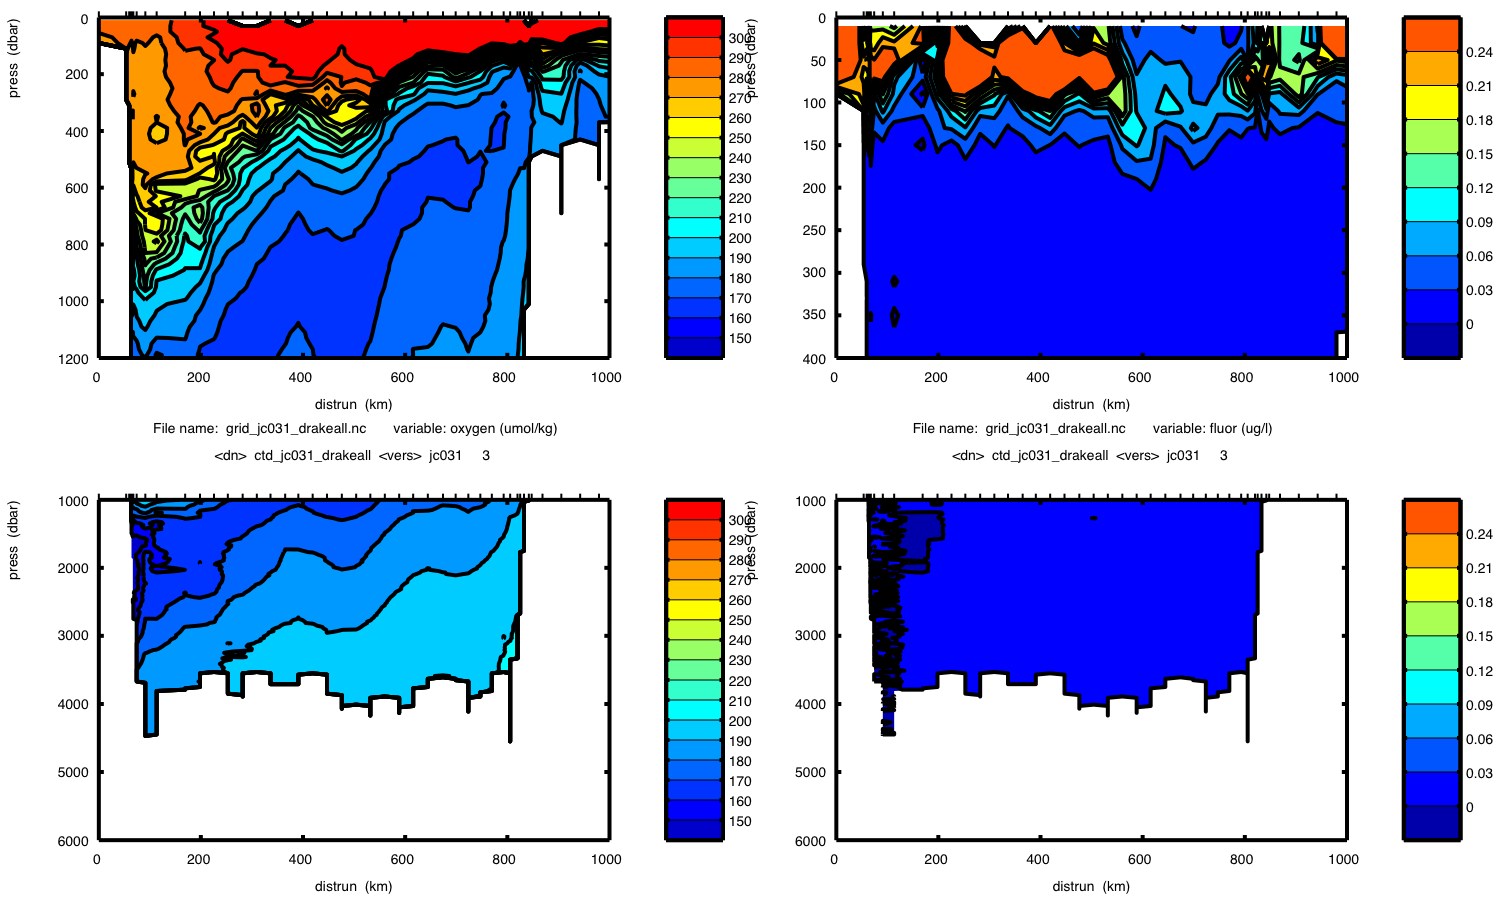
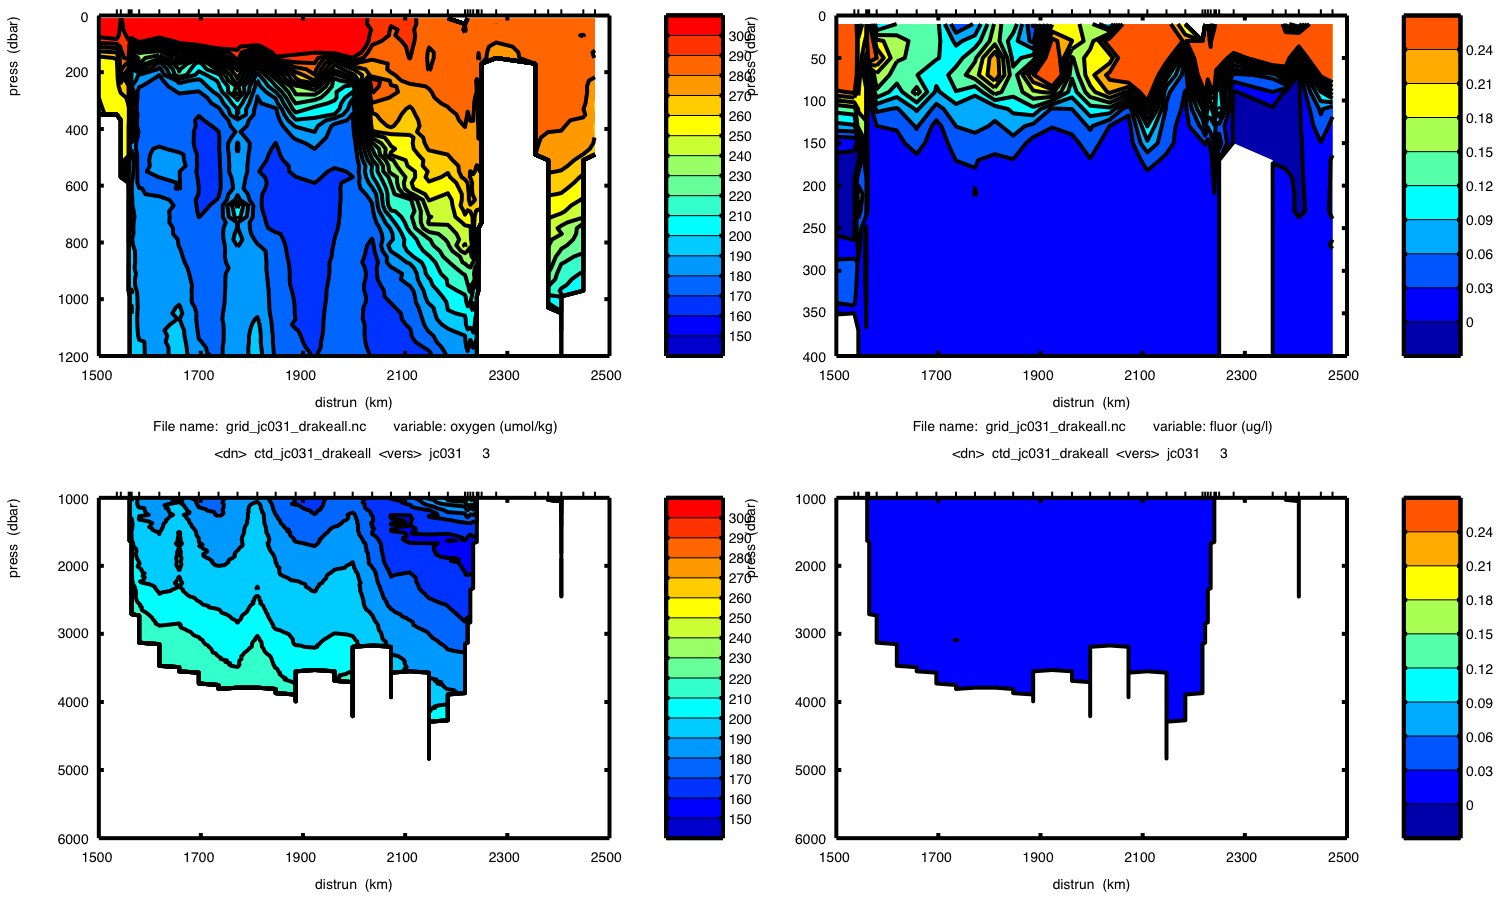
CTD Oxygen (left) Fluoresence (right)
CO2

Section SR1B
CFC11 (left) CFC12 (right)

F113 (left) CCl4 (right)

SF6
Bottle Oxygen (left) Silicate (right)

Total Nitrate (left) Phospate (right)
Potential Temperature (left) Salinity (right)
CTD Oxygen (left) Fluoresence (right)
CO2
