Polarfront Data
Contact: Margaret Yelland or Robin Pascal
**** The weather ship Polarfront was withdrawn from service in December 2009.
**** A follow on project "Waves Aerosols and Gas Exchange Study" will be based on the BAS ship RRS James Clark Ross from summer 2010 to at least end of 2012
Data from the Polarfront are sent daily. The daily messages contain one sample averaged over a 15 minute period per hour. Some of the data displayed here were obtained by the Norwegian Met Office (DNMI) systems.
NOTE The data displayed here have NOT been quality controlled.
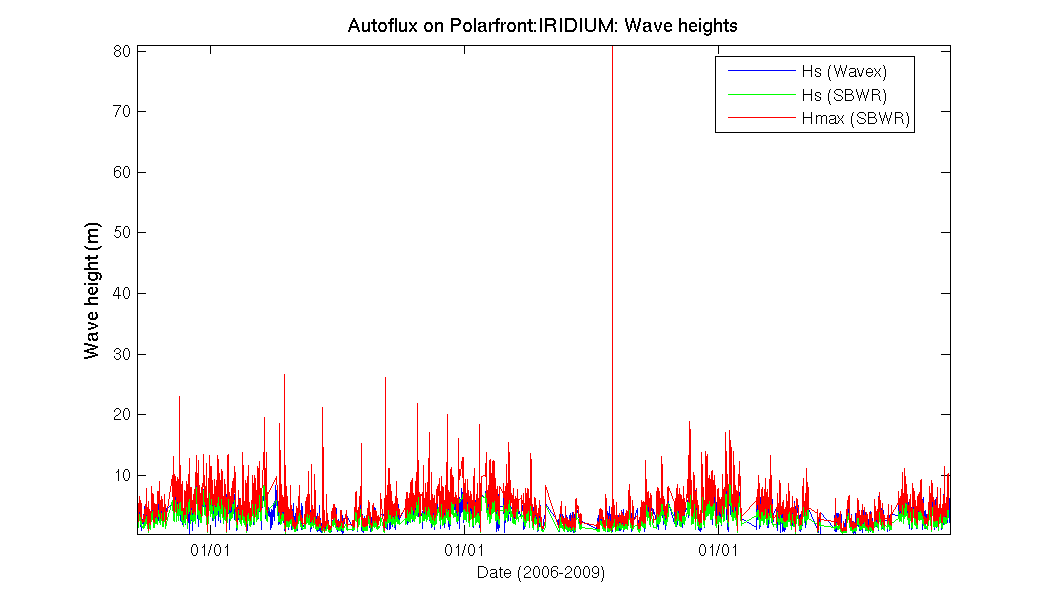
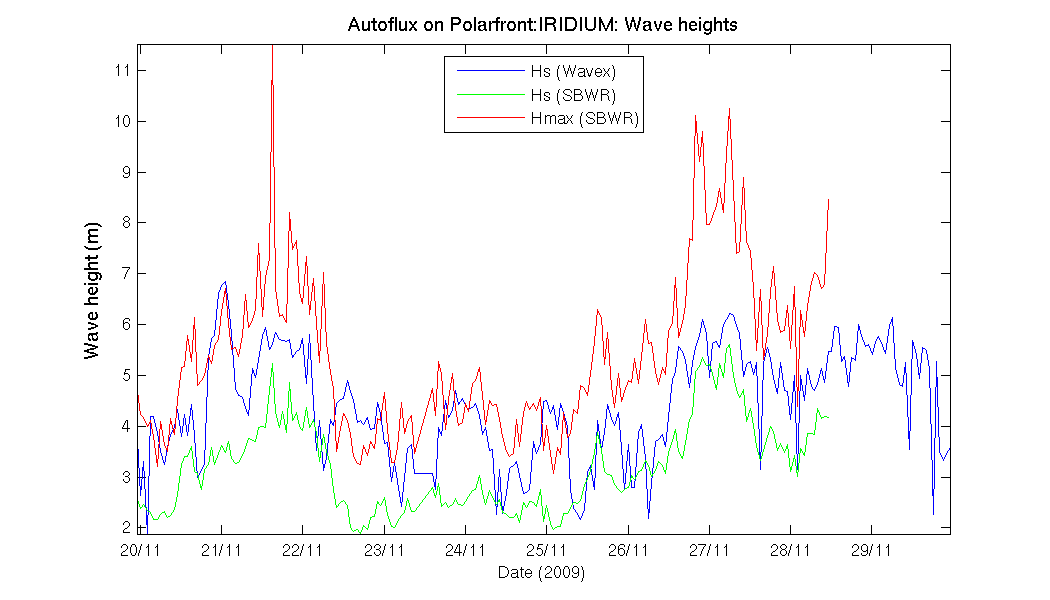
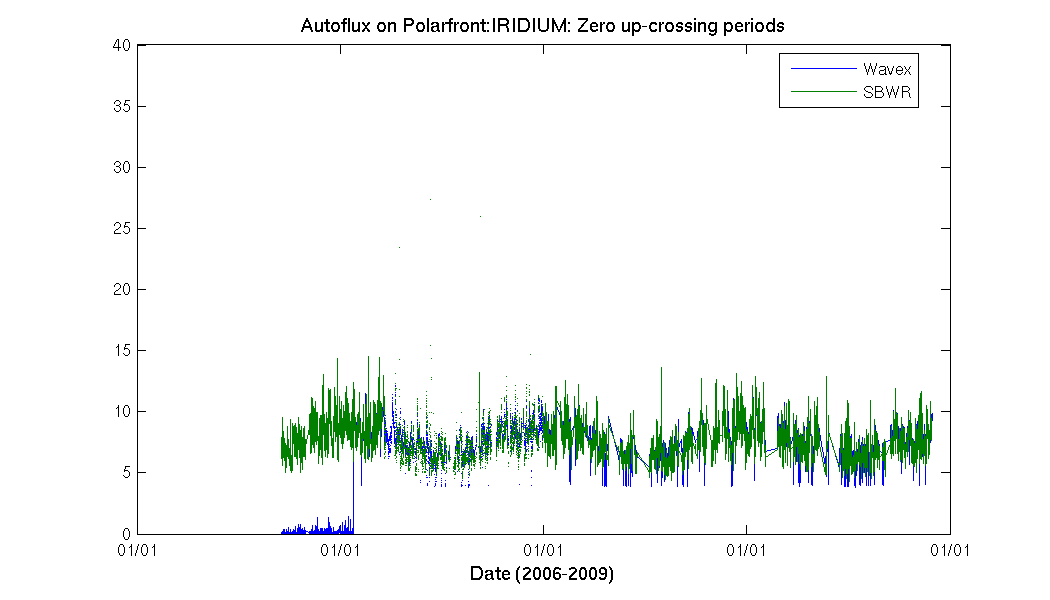
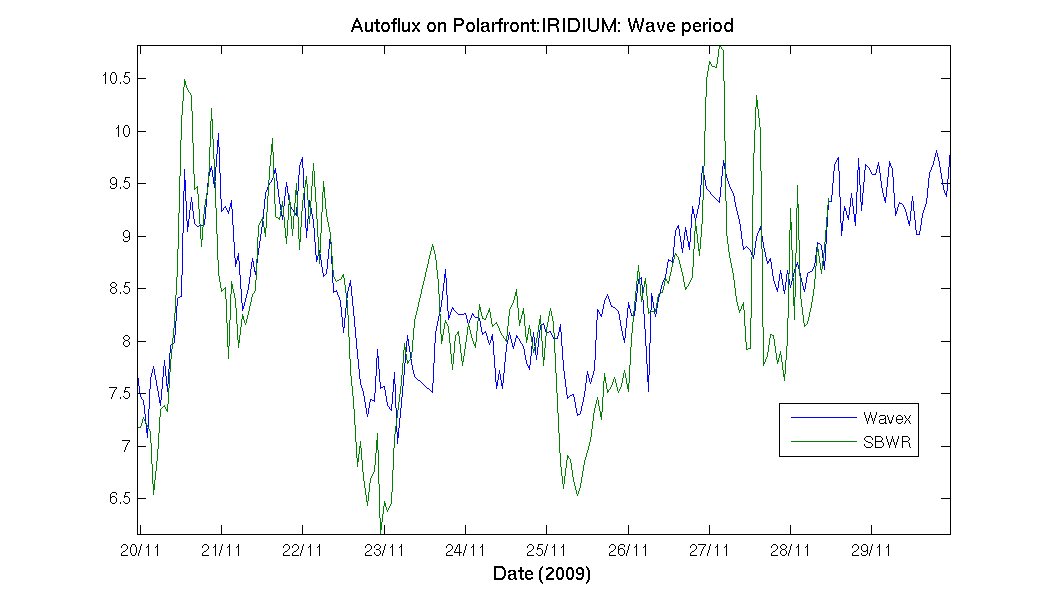
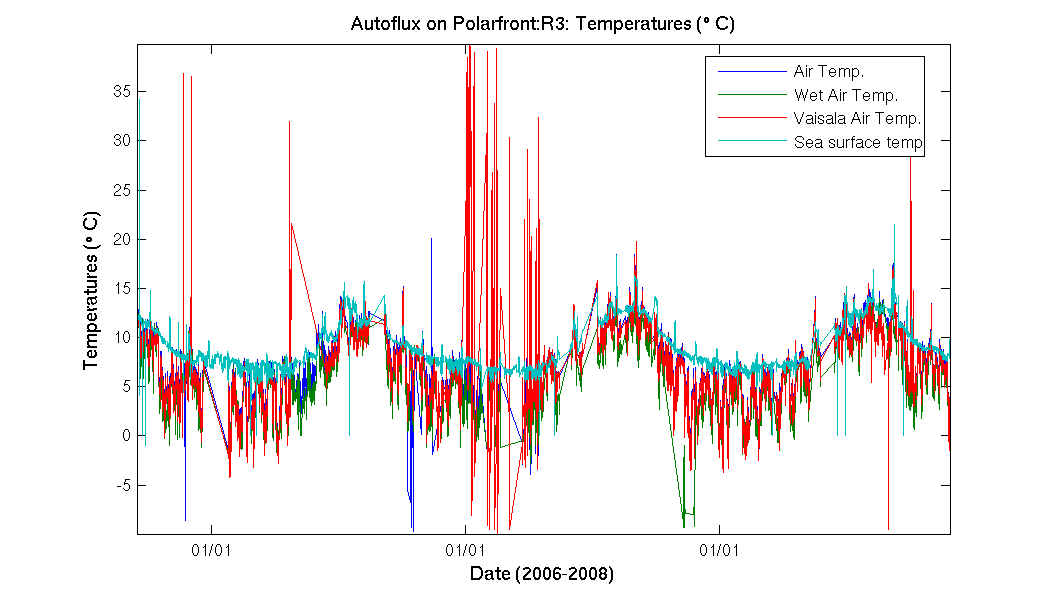
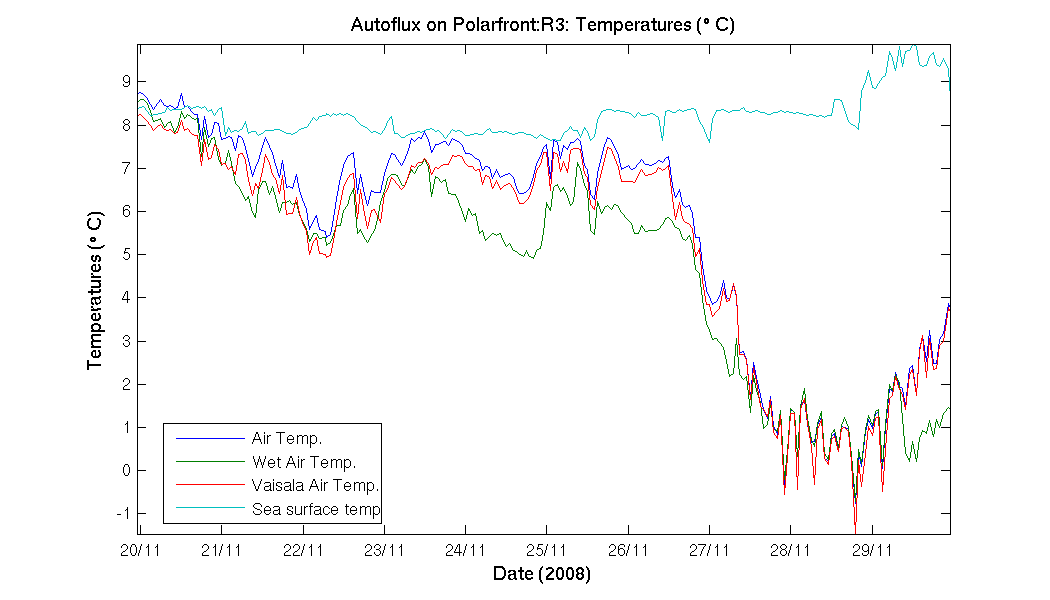
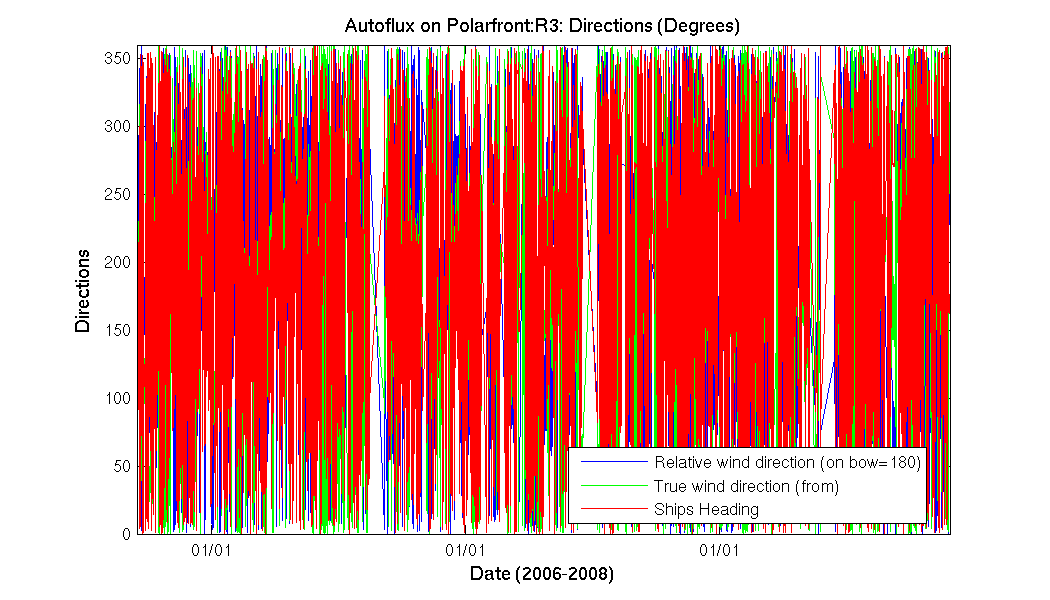
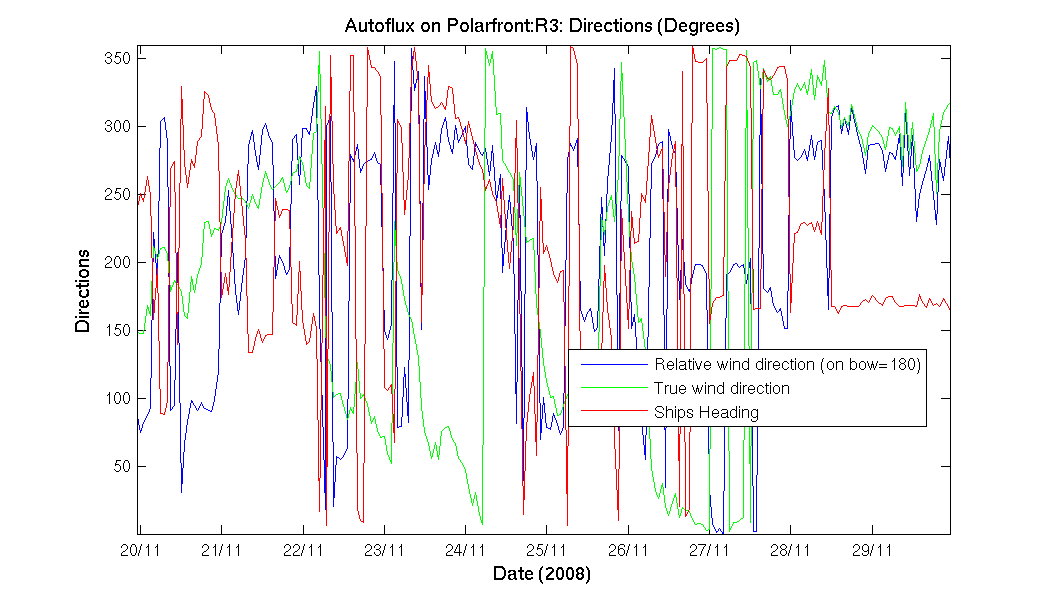
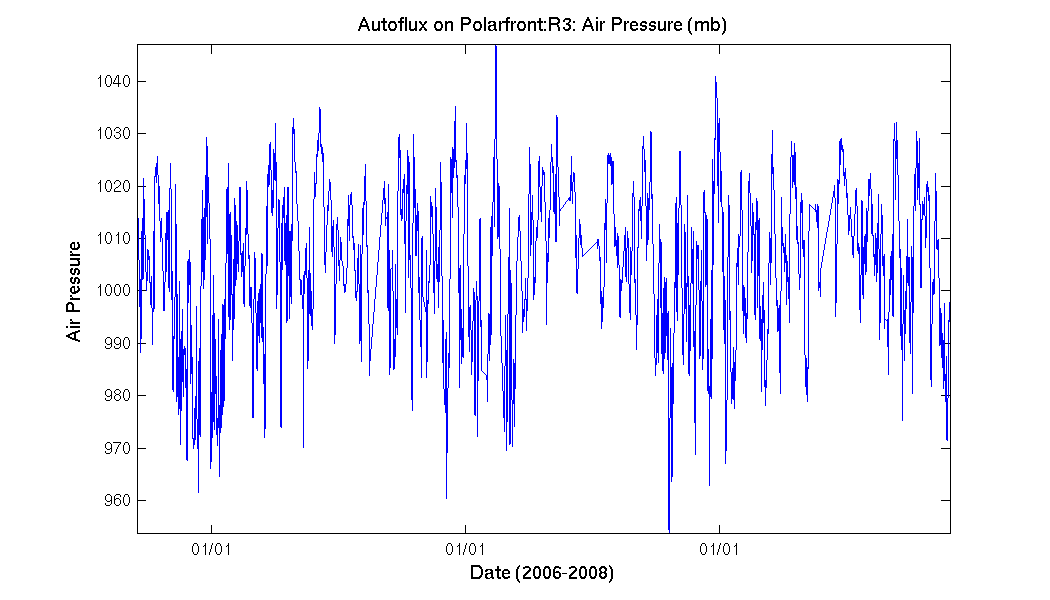
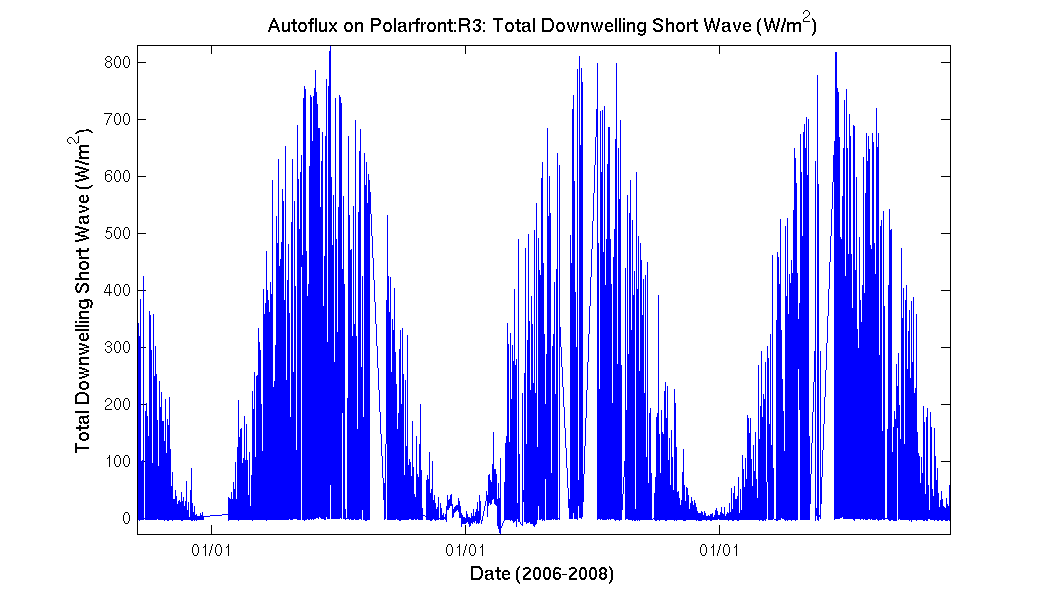
The larger of each pair of plots shows data obtained over the last 10 days. Click to enlarge. The smaller of each pair shows data from the whole deployment. Again, click to enlarge. Data which appear absent may just be due to communications problems with the iridium system.
Return to HiWASE project page.
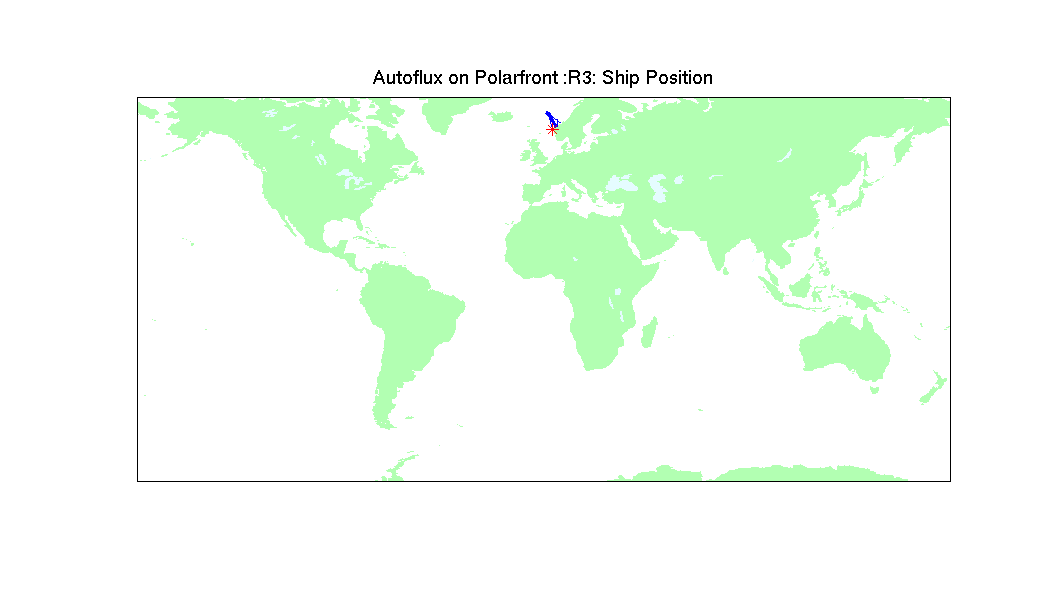
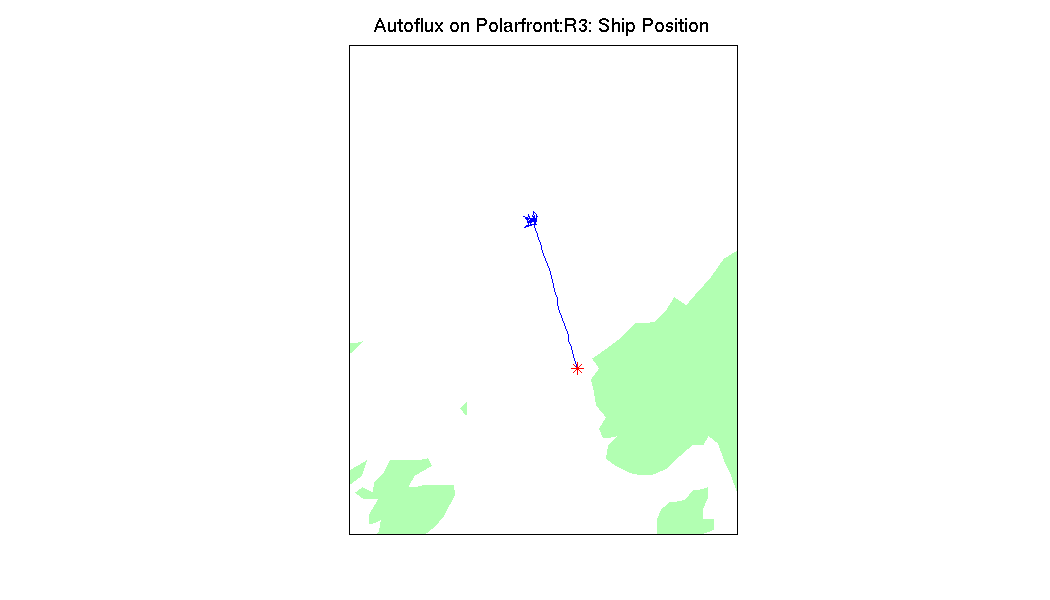
Ship Position The ship occupies Sation Mike at 66N 2E all year round, so the cruise track is not very interesting...
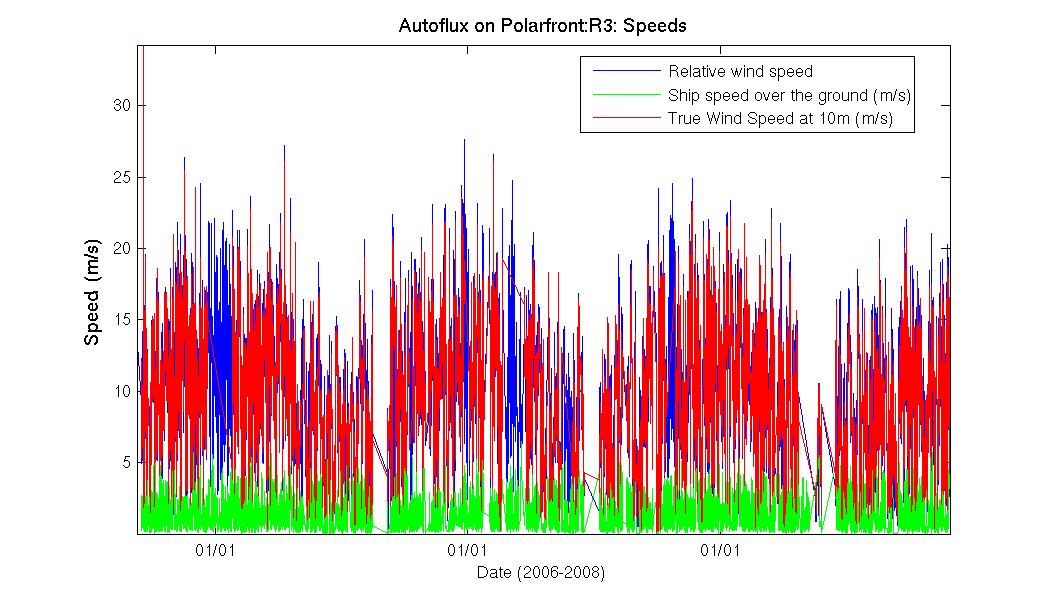
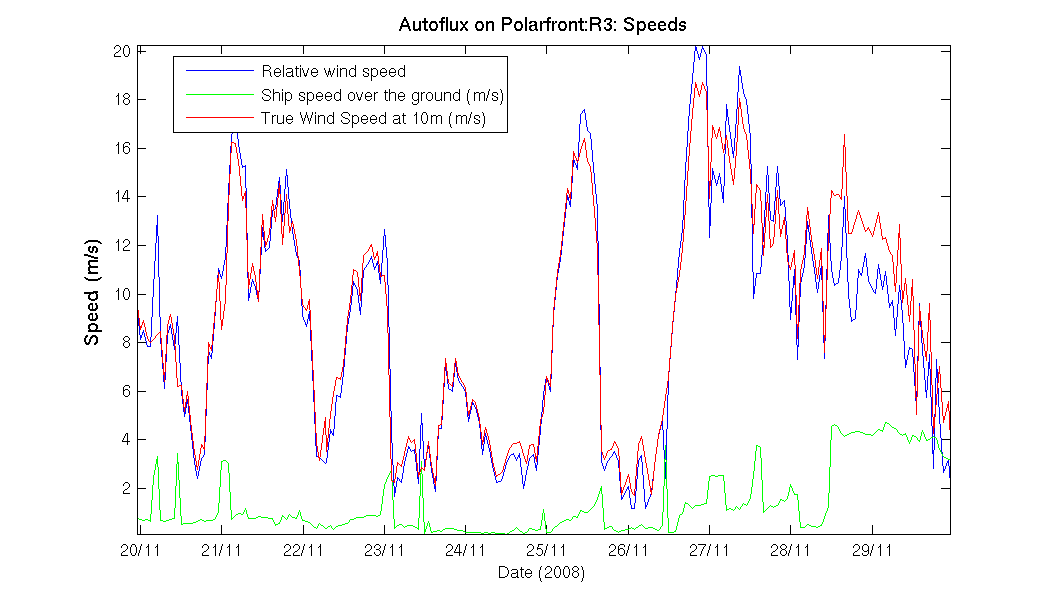
Speeds (m/s) Red - true wind speed corrected to 10 m and neutral stability (the corrections require a number of mean meteorological and navigation parameters, so if any of these are missing the true wind will also appear absent). Blue - wind speed as measured (no corrections). Green - ship speed over the ground. 1 m/s is roughly 2 knots. See these Met Office pages to convert from wind speed into "Force xx" on the Beaufort scale.
Wave heights (m) Blue - estimated significant wave height from the Wavex wave radar system. Green - measured significant wave height from the Ship Borne Wave Recorder (SBWR). Red - maximum measured peak to trough height from the SBWR. The Wavex system was installed as part of the HiWASE project. The SBWR was installed in the mid-1990's by DNMI. NOTE - there is a temporary problem withour data link to the SBWR, but the ship's crew have informed us that the SBWR itself is working fine.
Zero-upcrossing-period (s) Blue - from the Wavex system. Green - from the SBWR. Both calculated from the m0 and m2 spectral moments. NOTE prior to 24/01/07 the Wavex parameters output on IRIDIUM were different, so the periods shown prior to that date are wrong. Also, periods from the SBWR are not corrected for ship speed.
Temperatures (deg C) Dark blue - air temp from the NOC psychrometer. Red - air temp from the NOC Vaisala. Green - wet bulb temp from the NOC psychrometer (not well at the moment but there is plenty of redundancy for humidity). Light blue - sea surface temp from one of the DNMI hull contact sensors.
Directions Red - ship's heading (degrees to). Green - true wind direction (degrees from). Blue - wind direction relative to the ship (wind on bow = 180)
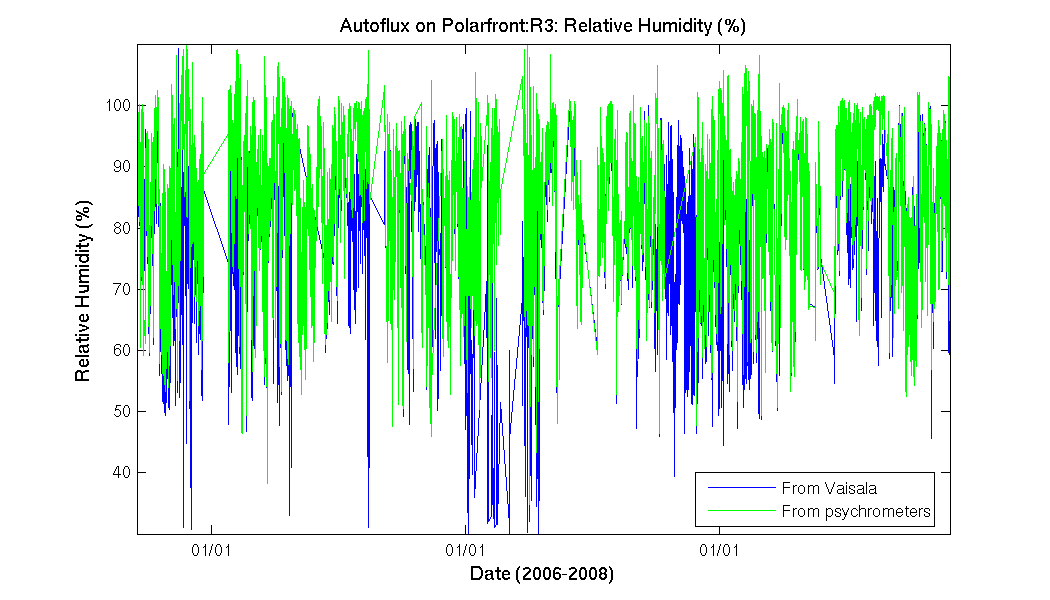
Relative Humidity (%) Green - calculated from the wet and dry bulb temperatures from the NOC psychrometer. Blue - from the NOC Vaisala. Note - when the water reservoir for the psychrometer's wet bulb dries out the calculated humidity becomes roughly 100%.
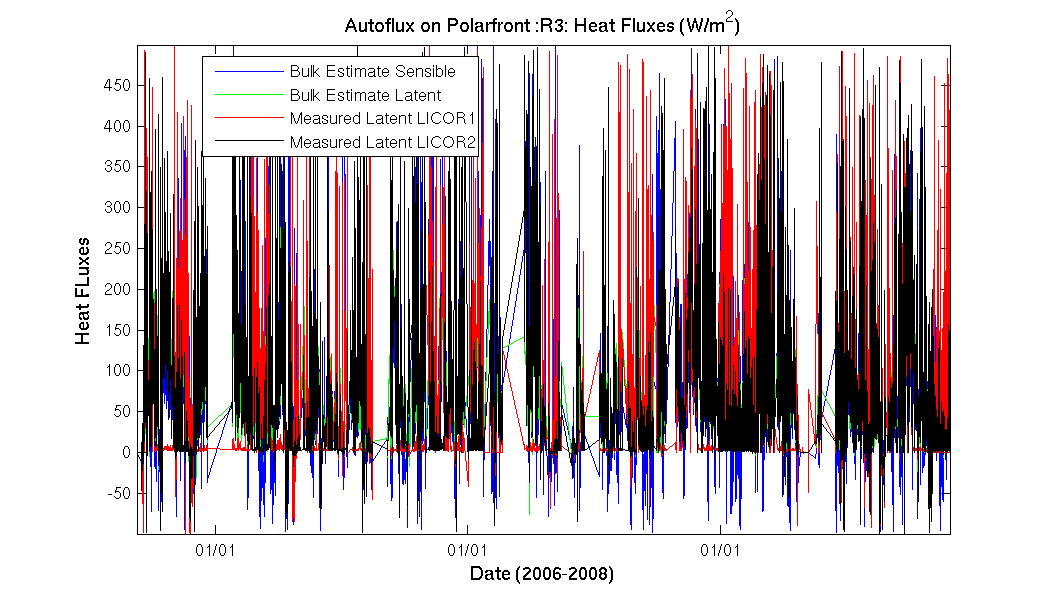
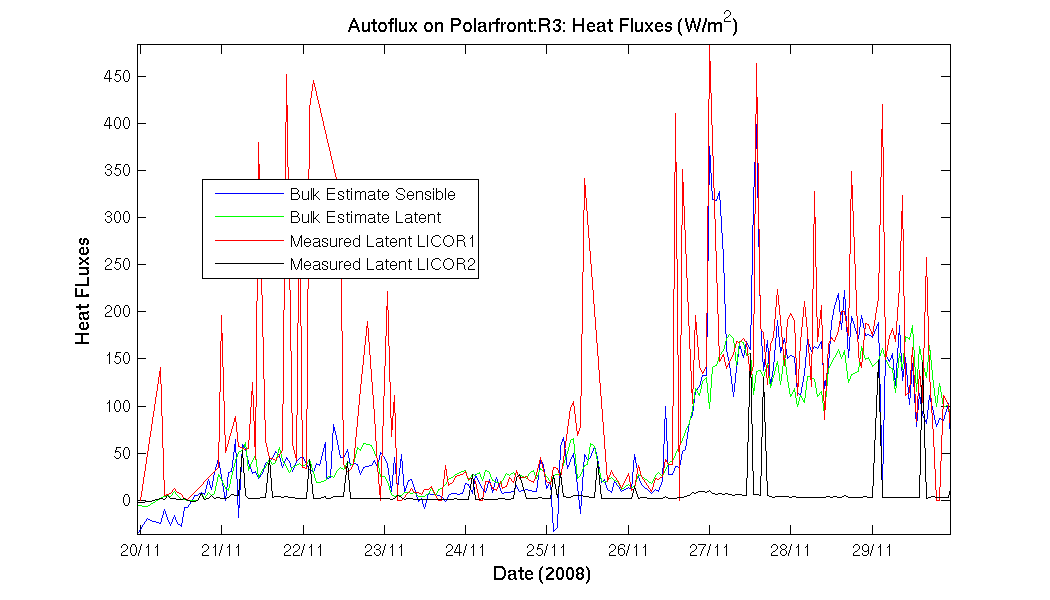
Heat Fluxes (W/m2) Bulk estimates of the sensible (blue) and latent (green) heat fluxes. Latent heat fluxes calculated via the dissipation method are shown for the two Licor sensors. The Licors are shrouded for one cruise at a time in turn - this results in a zero flux being measured. Spikes in the zero flux occur when Licor data are absent for some reason and a bulk value is calculated instead. The shrouded Licor is not working properly at the moment so instead of small ID fluxes being calculated, a default bulk estimate is being used.
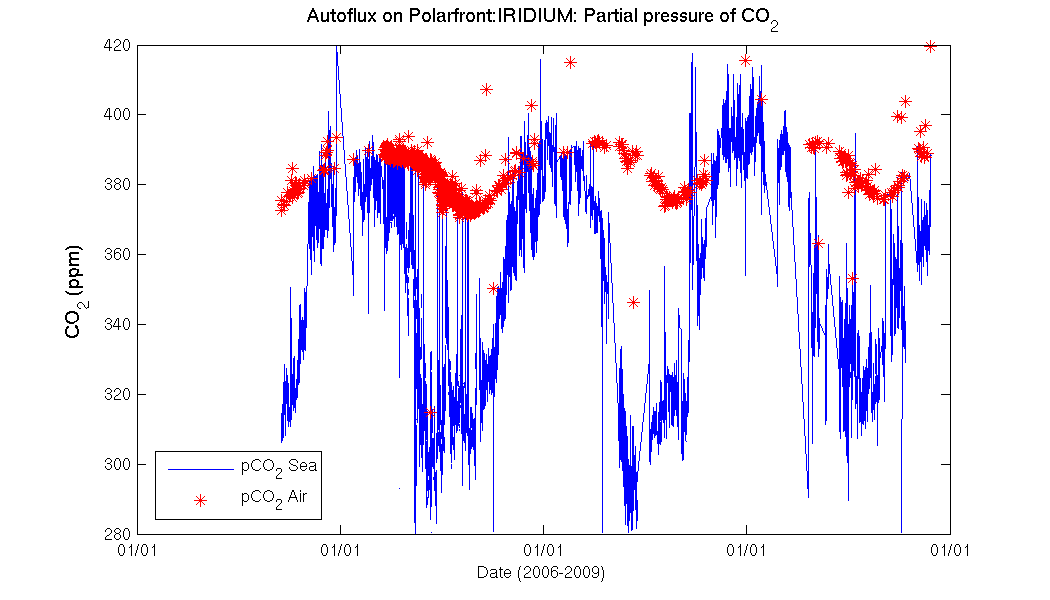
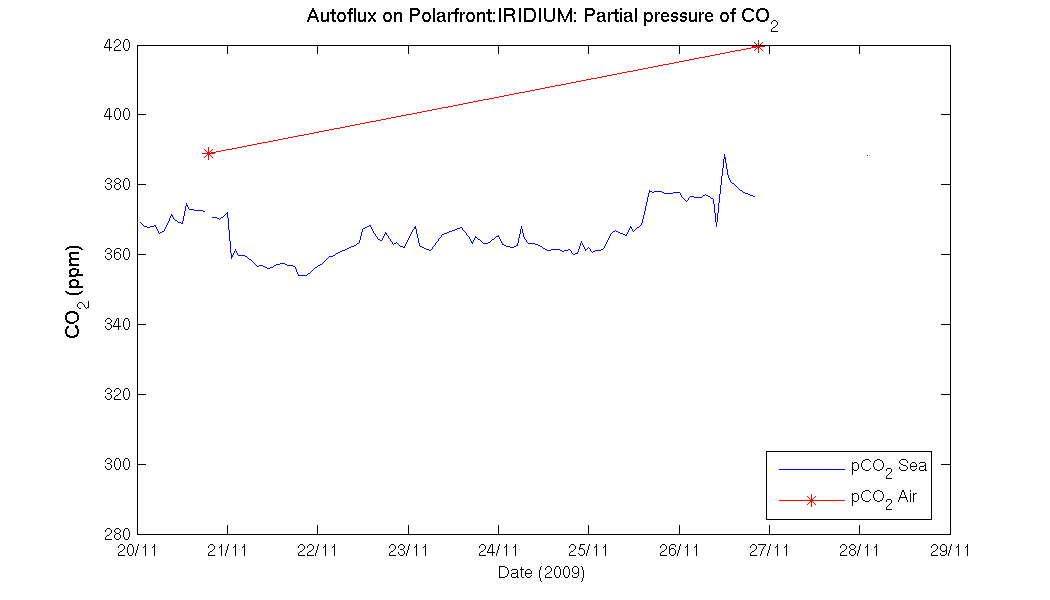
CO2 concentration. Raw underway CO2 concentrations in the surface water from the underway system operated by the Bjerknes Centre for Climate Research, Norway. The large plot shows the last 10 days of data. In some samples calibration standards may be included in the average, causing spikes in the data shown here. Click on the small plot to the left to see all data since the start of the project nearly 2 years ago.

