CFD modelling of research ships
Contact: Dr Ben Moat
Wind speed measurements obtained from ships are subject to systematic errors. These errors are caused by the distortion of the air flow around the ships hull and superstructure, an effect which is well known qualitatively.
The effects of flow distortion can be significant even in the case of anemometers located in well exposed sites on research ships. It is therefore necessary to correct such ship based measurements for these effects if accurate wind speed or surface flux estimates are to be obtained.
The Computational Fluid Dynamics (CFD) code VECTIS by Ricardo Software was used to simulate the airflow over a number of research ships. The simulations were solved using computational grids of up to 3 million cells. Results from various ship models are shown below.
ODEN:-
Funding has been obtained to model the airflow over the Swedish ice breaker Oden, as part of the ACSE - Arctic Cloud Surface response Experiment (NERC grant: NE/K011820/1). This will be undertaken during 2014/2015.
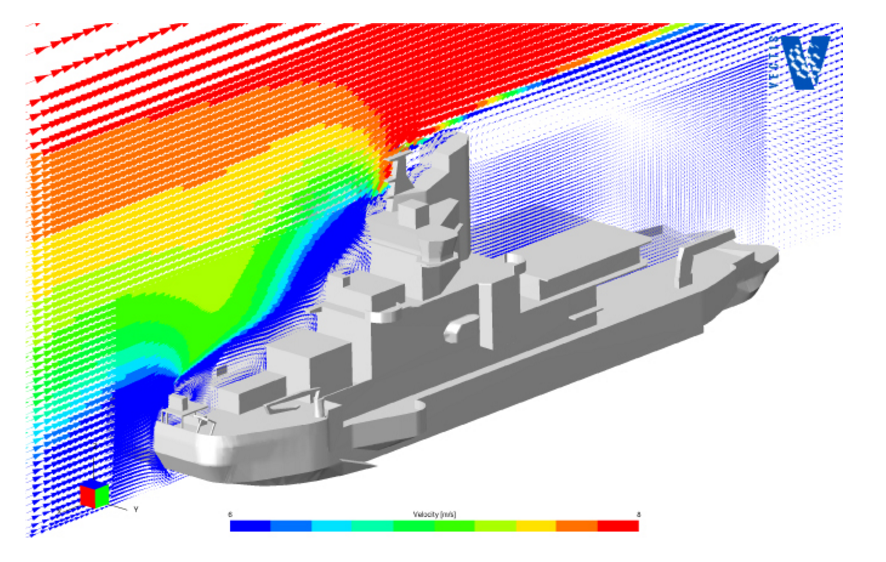
Fig. 1 : the bow-on airflow over the Oden (blue represents a low wind speed and red a high wind speed)
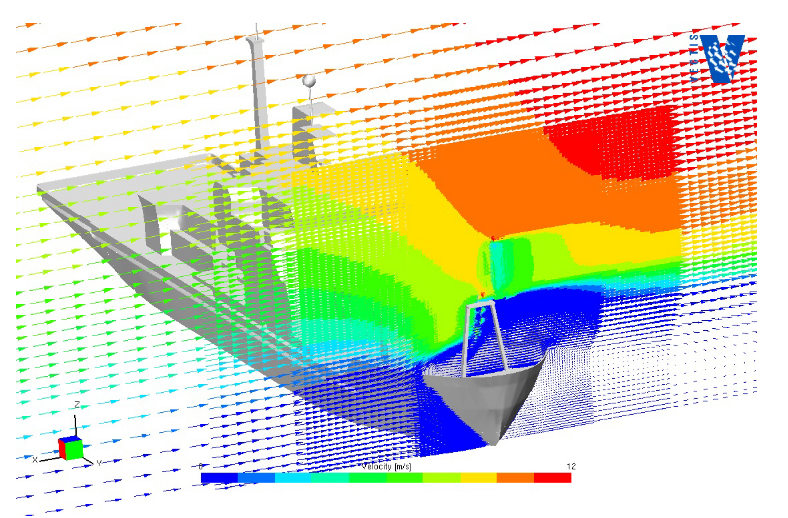
Fig. 2 : the beam-on airflow over the Oden (blue represents a low wind speed and red a high wind speed)
References
- Moat B. I., M. J. Yelland and I. M. Brooks, 2015 Airflow distortion at instrument sites on the ODEN during the ACSE project.Southampton, National Oceanography Centre, 114pp. (National Oceanography Centre Internal Document, No. 17) pdf
- Achtert, P., Brooks, I. M., Brooks, B. J., Moat, B. I., Prytherch, J., Persson, P. O. G., and Tjernström, M, 2015: Measurement of wind profiles by motion-stabilised ship-borne Doppler lidar, Atmos. Meas. Tech., 8, 4993-5007, doi:10.5194/amt-8-4993-2015.
RRS James Clark Ross:-
Wind speed corrections due to airflow distortion have been produced for instrumentation mounted on the RRS James Clark Ross during the WAGES project (NERC grant: NE/G00353X/1).
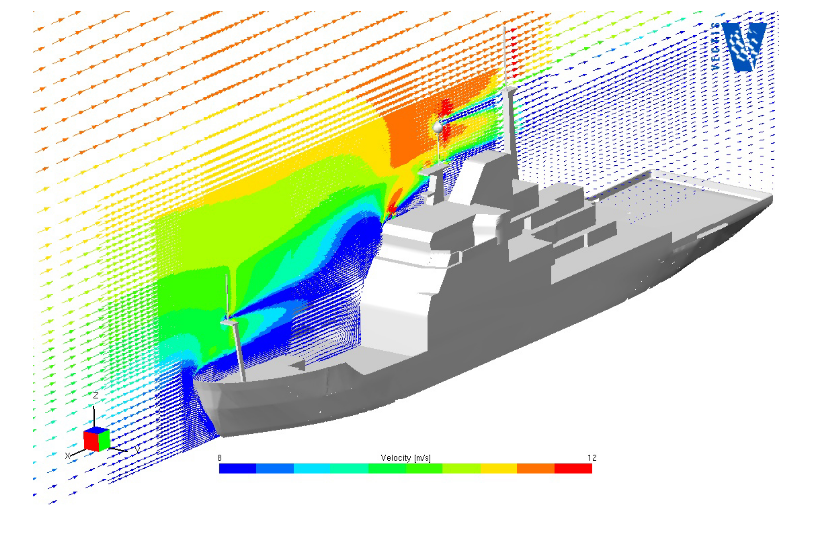
Fig. 1 : the bow-on airflow over the RRS James Clark Ross (blue represents a low wind speed and red a high wind speed)
References
- Moat B. I. and M. J. Yelland, 2015: Airflow distortion at instrument sites on the RRS James Clark Ross during the WAGES project, National Oceanography Centre, 85pp. (National Oceanography Centre Internal Document, No. 12). pdf
- Yelland, M. J. B. I. Moat, R. W. Pascal, and D. I. Berry, 2002: CFD model estimates of the airflow over research ships and the impact on momentum flux measurements, J. of Atmos. and Ocean. Tech., 19(10), 1477-1499.
- Berry, D. I., B. I. Moat, M. J. Yelland, 2001: Airflow distortion at instrument sites on the RRS James Clark Ross, SOC Internal Document No. 75, Southampton Oceanography Centre, UK. 83 pp. pdf
OWS Polarfront:-
Computational Fluid Dynamics (CFD) modelling was used to study the flow of air over the Polarfront to determine the wind speed bias at the anemomter locations.
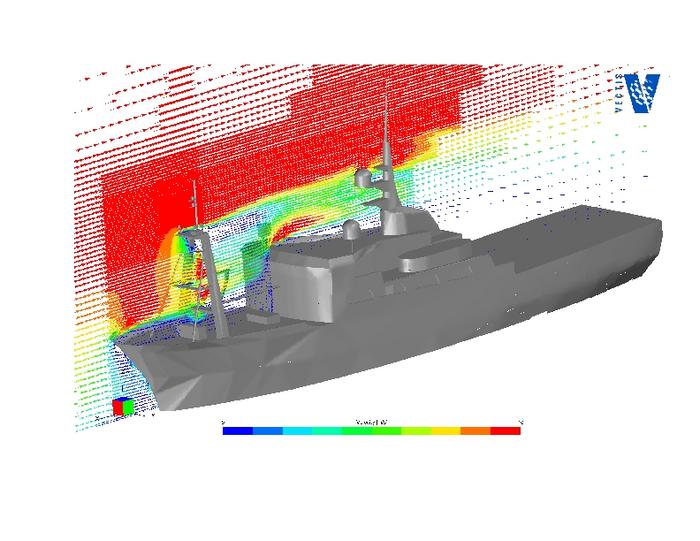
Fig. 1 : the bow-on airflow over the OWS Polarfront (blue represents a low wind speed and red a high wind speed)
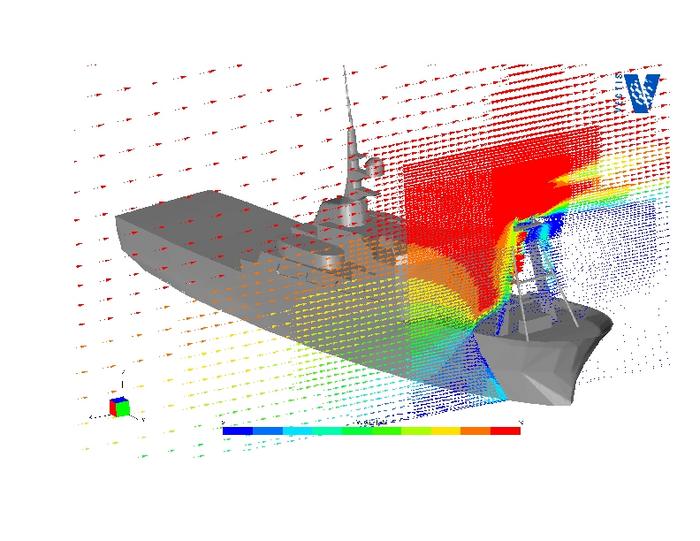
Fig. 2 : the airflow 100 degrees off the starboard bow of the OWS Polarfront (blue represents a low wind speed and red a high wind speed)
This UK-SOLAS project (HiWASE) was funded by the Natural Environment Research Council (grant number NE/C001826/1).
References
- Yelland, M.J., Pascal, R.W., Taylor, P.K. and Moat, B.I., 2009: AutoFlux: an autonomous system for the direct measurement of the air-sea fluxes of CO2, heat and momentum. Journal of Operational Oceanography, 2, (1), 15-23.
- Moat, B. I. and M. J. Yelland, 2009: Air Flow distortion at anemometer sites on the Polarfront, NOC Internal Document 14, National Oceanography Centre, Southampton, UK. 35pp. pdf
RRS James Cook:-
The Natural Enviroment Research Council (NERC) took delivery of the research ship the RRS James Cook in August 2006.
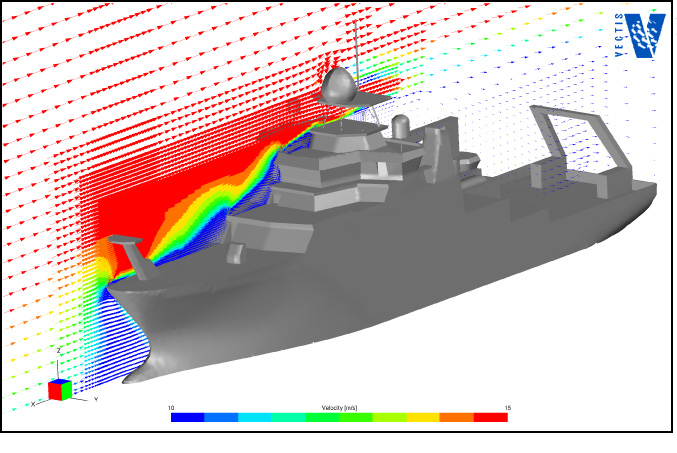
Fig. 1 : The bow-on airflow (blue represents a low wind speed and red a high wind speed)
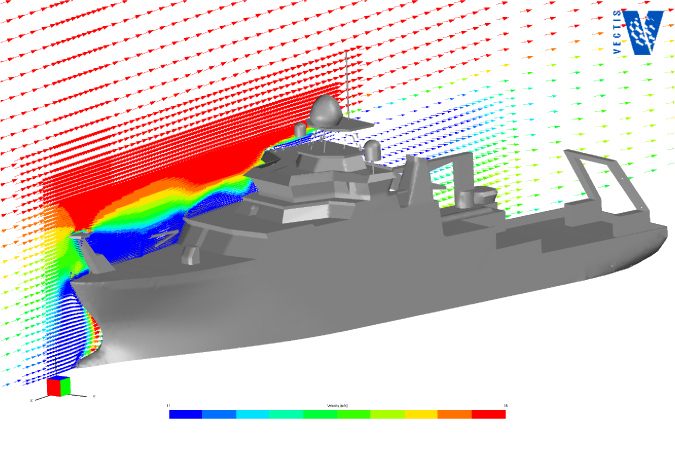
Fig. 2 : The airflow 15 degrees off the port bow (blue represents a low wind speed and red a high wind speed)
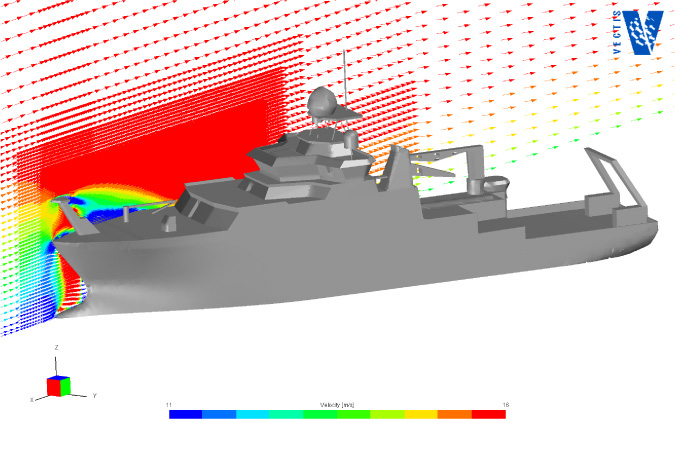
Fig. 3 : the airflow 30 degrees off the port bow (blue represents a low wind speed and red a high wind speed)
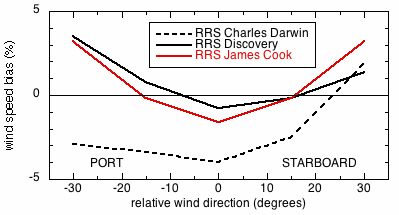
Fig. 4: A comparison of the wind speed bias at anemometer locations on the foremast of the RRS Discovery, RRS Charles Darwin and RRS James Cook (Moat and Yelland, 2008).
This project was funded by the National Oceanography Centre Technology Innovation Fund (TIF).
References
- Moat, B. I. and M. J. Yelland, 2008: Going with the flow: state of the art marine meteorological measurements on the new NERC research vessel, Weather, 63(6), 158-159.
- Moat, B. I. and M. J. Yelland, 2009: The Air Flow distortion at anemometer sites on the RRS James Cook, Research and consultncy Report 11, National Oceanography Centre, Southampton, UK. 44pp. pdf
RV Knorr, RV Ron Brown, FS Polarstern and RV Tangaroa:-
Corrections for instruments on the NOAA ship RV Ron Brown, WHOI ship RV Knorr, the AWI ship Polarstern and the NIWA vessel RV Tangaroa have been calcualted.
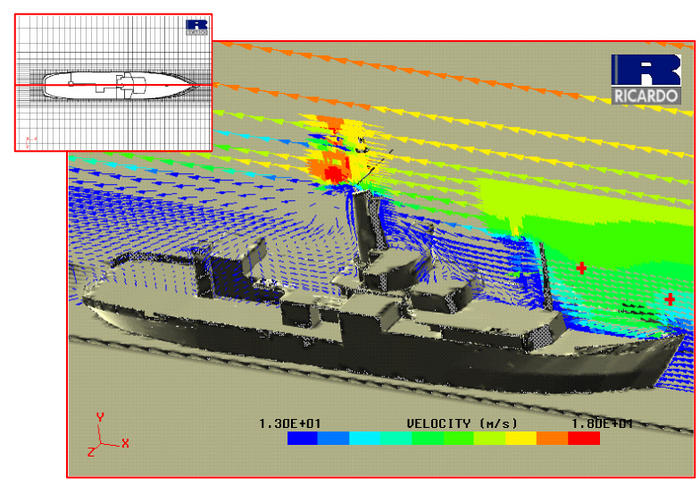
Fig. 1 The air flow directly over the bow of the RV Knorr (blue represents a low wind speed and red a high wind speed)
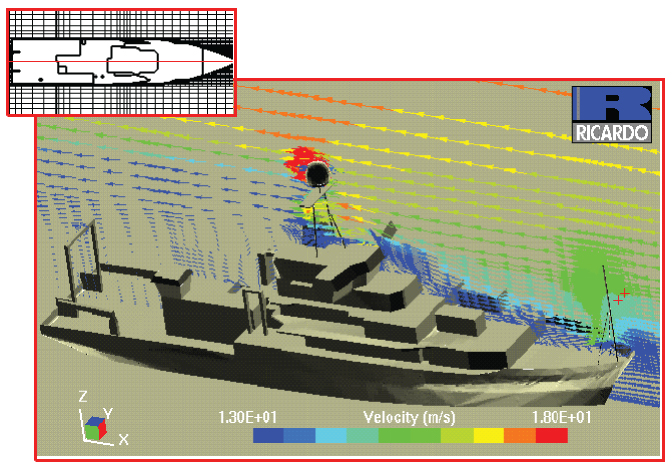
Fig. 2 The air flow directly over the bow of the RV Ron Brown (blue represents a low wind speed and red a high wind speed)
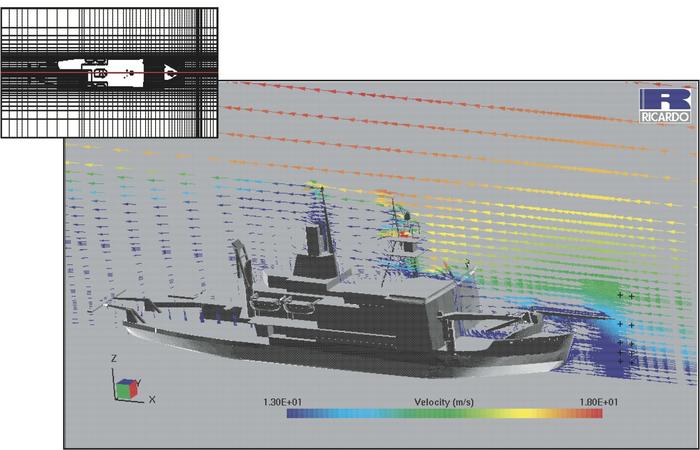
Fig. 3 The air flow directly over the bow of the FS Polarstern (blue represents a low wind speed and red a high wind speed)
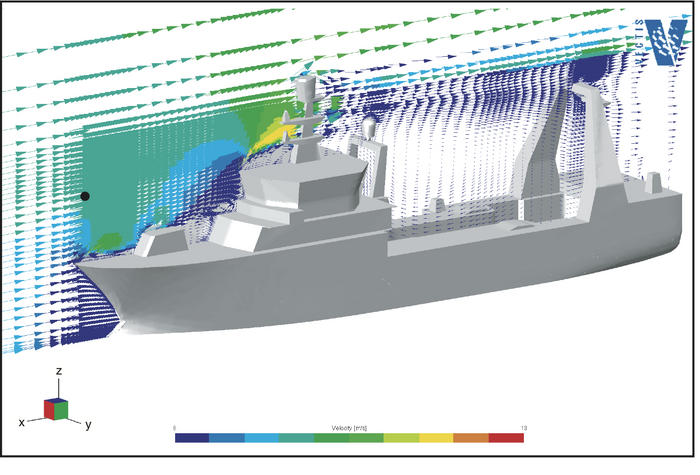
Fig. 4 The air flow directly over the bow of the RV Tangaroa (blue represents a low wind speed and red a high wind speed)
- Moat, B.I. and Yelland, M.J., 1998: Airflow distortion at instrument sites on the RV Knorr. Southampton, UK, Southampton Oceanography Centre, 32pp. pdf
- Moat, B. I., D. I. Berry and M. J. Yelland, 2001: The Air Flow distortion at anemometer sites on the RV Ronald H. Brown, SOC Internal Document 66, National Oceanography Centre, Southampton, UK. 26pp. pdf
- Berry, D. I., B. I. Moat and M. J. Yelland, 2001: The Air Flow distortion at anemometer sites on the FS Polarstern, SOC Internal Document 69, National Oceanography Centre, Southampton, UK. 26pp.
- Moat, B. I. and M. J. Yelland, 2005: Air Flow distortion at instrument sites on the RV Tangaroa, NOC Internal Document 1, National Oceanography Centre, Southampton, UK. 90pp. pdf
Publications
- Griessbaum, F.; Moat, B.I.; Narita, Y.; Yelland, M.J.; Klemm, O.; Uematsu, M.. 2010 Uncertainties in wind speed dependent CO2 transfer velocities due to airflow distortion at anemometer sites on ships. Atmospheric Chemistry and Physics, 10. 5123-5133.10.5194/acp-10-5123-2010
- Moat, B.I. and Yelland, M.J., 2008 Going with the flow: state of the art marine meteorological measurements on the new NERC research vessel. Weather, 63 (6). 158-159. 10.1002/wea.184
- Moat, B.I., Yelland, M.J., Molland, A.F.. 2006 Quantifying the airflow distortion over merchant ships. Part II: application of the model results. Journal of Atmospheric and Oceanic Technology, 23 (3). 351-360. 10.1175/JTECH1859.1
- Moat, B.I., Yelland, M.J., Pascal, R.W., Molland, A.F.. 2006 Quantifying the airflow distortion over merchant ships. Part I: validation of a CFD model. Journal of Atmospheric and Oceanic Technology, 23 (3). 341-350. 10.1175/JTECH1858.1
- Moat, B.I., Yelland, M.J.; Pascal, R.W., Molland, A.F.. 2005 An overview of the airflow distortion at anemometer sites on ships.International Journal of Climatology, 25 (7). 997-1006. 10.1002/joc.1177
- Yelland, M.J., Moat, B.I.; Pascal, R.W.; Berry, D.I.. 2002 CFD model estimates of the airflow distortion over research ships and the impact on momentum flux measurements. Journal of Atmospheric and Oceanic Technology, 19 (10). 1477-1499.
- Yelland, M.J., Moat, B.I., Taylor, P.K., Pascal, R.W.; Hutchings, J., Cornell, V.C.. 1998 Wind stress measurements from the open ocean corrected for air flow distortion by the ship. Journal of Physical Oceanography, 28 (7). 1511-1526.