Phytoplankton Plunder Nutrients
Analysis using models: An understanding the overwhelming importance of biological removal in setting nutrient concentrations in the ocean can be obtained by experimenting with the three different nutrient models. This experiment can be carried out with either the phosphate-only (P), the nitrate-phosphate (NP), or the silicate-phosphate (SiP) models. From the control panel of a model, select 'Model Parameters' and then change the growth rate of all phytoplankton in the model to zero (given that deaths will continue, the phytoplankton populations must then remorselessly decline over time). Click 'Apply and Close' to save the parameter changes and then click 'Run Model' on the main control panel. In the resulting plots you should see a striking effect, that the concentrations of all nutrients in all boxes increase steadily over time. Unlike most runs, they do not converge to an equilibrium value; the lines never flatten out. This is because they have been released from the otherwise incessant removal pressure by phytoplankton (you should also notice a plummeting of phytoplankton numbers at the beginning of the run). With phytoplankton populations no longer able to hold nutrient concentrations down, the nutrients escape to higher values.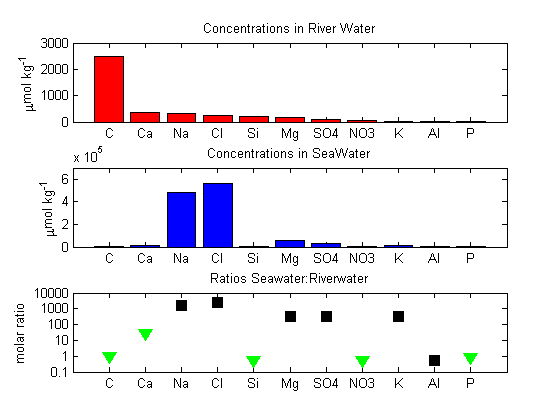
Comparison of dissolved substances in river water and in seawater. The top panel shows concentrations in river water, the middle panel concentrations in seawater, and the bottom panel the ratio of the two (mol/mol, on a log scale). Inverted green triangles denote elements which are widely used by marine organisms, either to make new soft tissues or else to make hard parts (e.g., shells out of calcium carbonate CaCO3 or opal SiO2). Black squares denote elements which are not heavily utilised by living organisms. All biologically-utilised elements are exceptionally scarce compared to expectations based on river supply and comparison to non-utilised elements. Aluminium is also surprisingly scarce, in this case because it tends to stick to falling particles and thereby gets rapidly removed from seawater.
In reality, some of these increases would eventually be capped by another process, such as inorganic precipitation of crystals of solid silica in the case of increasing dissolved silicate. This would start to come into play after dissolved silicate concentrations rise higher than about 1.2 mol kg-1, a lot higher than the normal deep-water concentration of about 0.1 mol kg-1. What happens in the NP and SiP models when only one of the two phytoplankton groups are prevented from growing?
A second way of examining this controlling pressure by phytoplankton is to artificially raise up the nutrient concentrations and then examine the response of the system. This run can be carried out in each nutrient model. First of all make sure to go to 'Model Parameters' from the control panel and then click on 'Default' and 'Apply and Close'. This is in order to remove the previous changes in phytoplankton growth rates. Then go to 'Initial Conditions' and double the deep concentration of nutrients. Save the changes with 'Apply and Close' and then run the model. You should notice a surge in phytoplankton numbers in response to the extra nutrients. This should then result in increased removal of the nutrients in question, leading eventually to a return of both nutrient concentrations and phytoplankton densities to normal values.
Comparing different elements: The seawater levels of the major nutrients (phosphate, nitrate, silicate) are, when considered over long timescales, under biological control. Silicon, the fifth-most abundant element dissolved in river water flowing down into the sea, is, by comparison, largely absent from seawater due to intense biological removal. We can get an idea of the importance of the plankton influence over nutrient levels from the figure to the right. The lack of intense biological removal of elements like sodium and chlorine leaves them to completely dominate sea-salt despite not being the most abundant dissolved constituents of the river water running into the sea. In general, the biologically-utilised elements are anomalously scarce in seawater. Biological removal also explains why carbon and calcium, the two most abundant dissolved constituents of river water, are relatively scarce in seawater (see figure to right). About 50% of the dry weight of plankton is made up of carbon. Both carbon and calcium are removed when calcium carbonate shells are formed in the surface ocean and sink to become permanently buried (and thereby lost from the ocean) in seafloor sediments.
This website is in its early stages of use. If you find it difficult to run a model in the way described, or find any other problems, your feedback will help us improve the site for future users.
Further reading
Tyrrell, T. (2004). Biotic Plunder: Control of the environment by biological exhaustion of resources, In: Scientists Debate Gaia: The Next Century, MIT Press, pages 137-147.