Phytoplankton Plundering of Phosphate
The phosphorus model is the simplest of all the ocean models. All phytoplankton require phosphorus (P) in order to live. The synthesis of new algal cells is not possible in the absence of P in the environment. The phosphorus model makes the assumption that all other required resources are present in sufficient quantity and that it is phosphate scarcity that sets the limit to the proliferation of phytoplankton. In common with many other ocean biogeochemical models, phytoplankton growth is limited only by phosphate in this model.

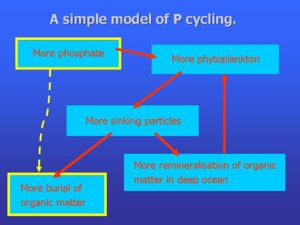
The second component making up the feedback is that increased phytoplankton growth tends to deplete phosphate levels in the ocean, as shown in the figure to the right. Firstly, as new phytoplankton cells grow, phosphate is removed from the surrounding seawater. However, this effect is only temporary (order of days), because when the cells die and decompose, the cellular P is returned to solution. A second feedback occurs because a proportion of phytoplankton cells sink out of the surface waters before being attacked by bacteria or zooplankton, following which their P is returned to deeper waters. This effect is also still only temporary however (order centuries) because the deeper water eventually return to the surface, taking their extra phosphate back with them. The last, but most important, effect is that a small proportion of the cells sink to the seafloor and become permanently incorporated into marine sediments. In this case the phosphorus is permanently removed from the oceans. Because the rate at which P is buried in marine sediments (lost from the system) is a fixed proportion of the surface primary production in the model, when there is more primary production there is necessarily more burial.
The key feedbacks to abnormally high or low phosphate (PO4) levels are therefore as follows:
High levels of PO4 in the ocean as a whole → more PO4 in upwelled/mixed up water → alleviation of growth rate inhibition → more phytoplankton growth → more burial → increased rate of loss of P from the system → PO4 levels come back down again.
Low levels of PO4 in the ocean as a whole → less PO4 in upwelled/mixed up water → exacerbation of growth rate inhibition → less phytoplankton growth → less burial → decreased rate of loss of P from the system → PO4 levels rise back up again.
The changes in burial contrast with the river input of P, which is presumed to stay constant. This explains why lower-than-normal P burial leads to the ocean filling up with phosphate.
Despite its extreme simplicity, the model is able to reproduce some of the main features of the distribution of phosphate in the global ocean: (1) low, biolimiting levels in most surface waters, (2) an average of about 2 μmol PO4 kg-1 in the deep ocean.
This stabilising feedback is part of wider pattern whereby phytoplankton removal keeps certain elements at anomalously low concentrations in seawater (click here for further explanation).
Other related pages
Phosphorus model overview
Phosphorus model details
Phosphorus model pros
Phosphorus model help
Phosphorus model worksheet
References
chapter 5 of W.S. Broecker and T.-H. Peng (1982) Tracers in the Sea, Eldigio Press. (still worth reading)
Tyrrell, T. (1999). The relative influences of nitrogen and phosphorus on oceanic primary production. Nature 400, 525–531.
External links
Description of primary production
Description of the chemical element phosphorus
Description of the phosphorus cycle