The PAP telemetry mooring was deployed early on 7th October 2002 during RV Discovery cruise D266.
Unfortunately the top 150m of the mooring became detached on 10/12/2002. The telemetry kit continued transmitting data from some of the Microcat sensors and regularly giving positional data. The equipment was recovered by RV Triton an 1st March 2003.
The equipment functioned as a float buoy while it was adrift, and that data can be viewed here.
Click on the images below to see the full size graph or create your own customised graph.
Read the notes on data quality here.
After recovery, data were archived at the British Oceanographic Data Centre (BODC) and can be accessed at: BODC PAP Collection, (please use the search term Porcupine or #5192 to find our data) and temperature, salinity, conductivity and pressure data can be retrieved in user selected formats from the BODC ERDDAP service.
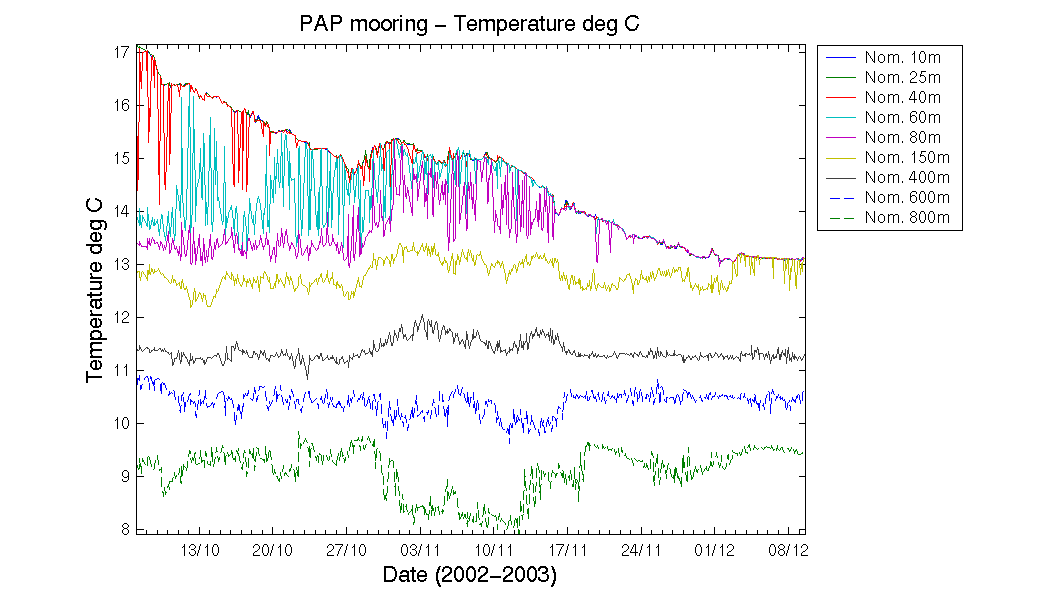
Temperature
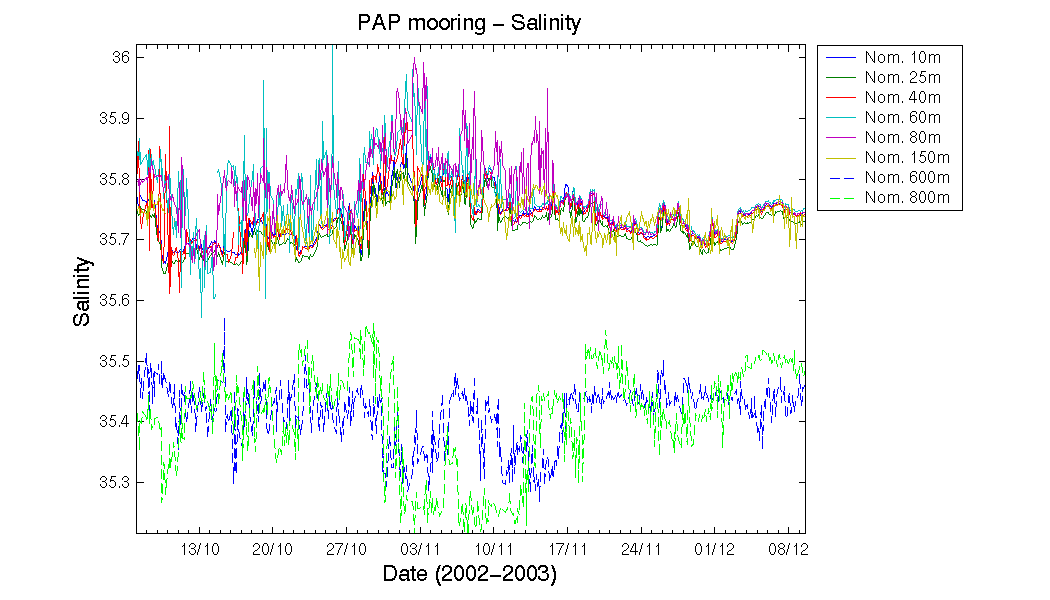
Salinity
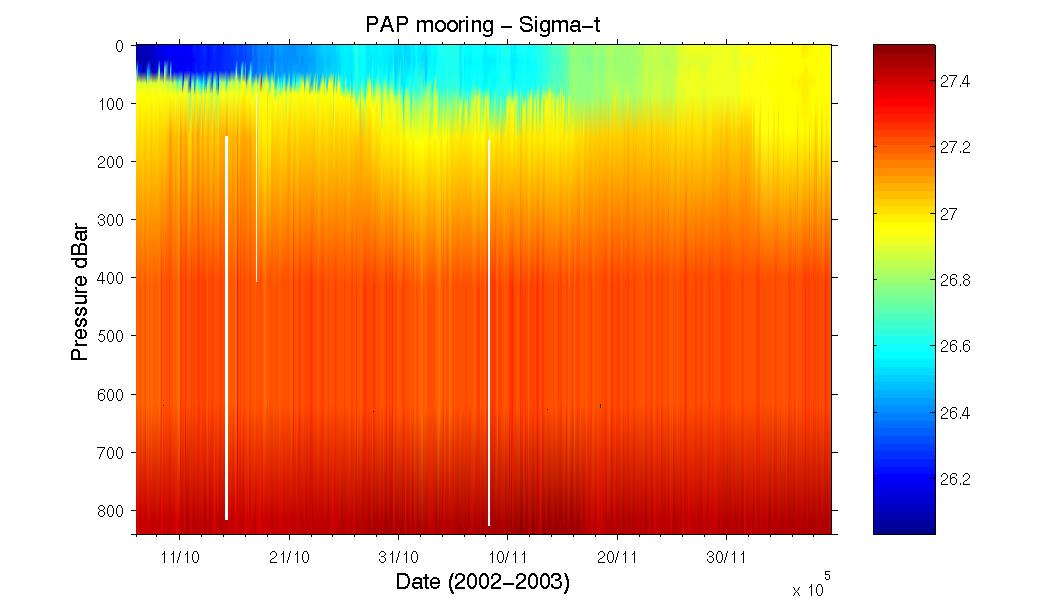
Sigma-t

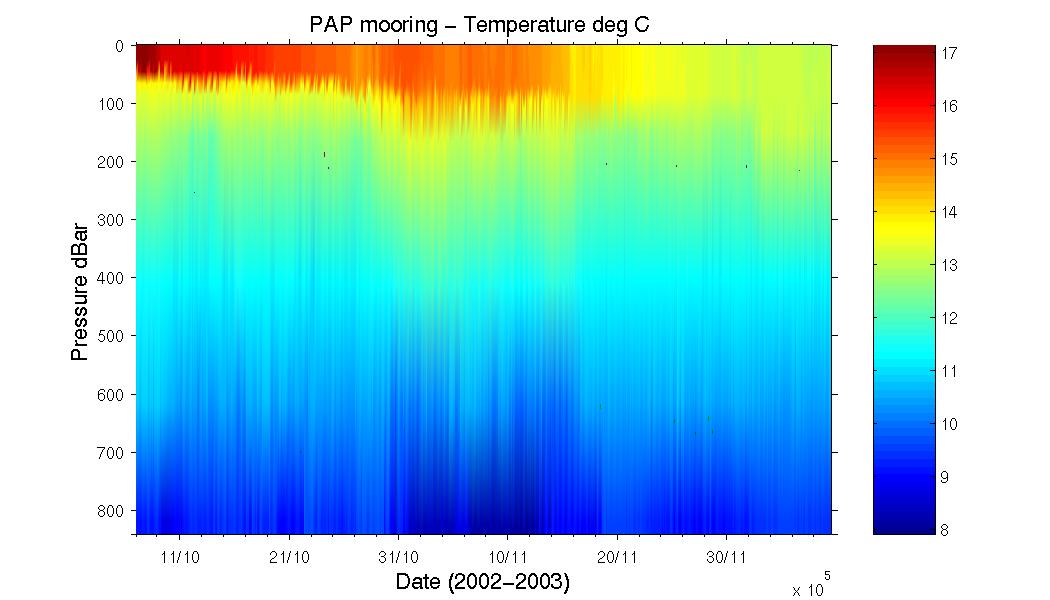
Temperature Profile
Salinity Profile

Sigma-t Profile
Delayed Mode Data
Recovered in July 2003 on Cruise Poseidon 300/1
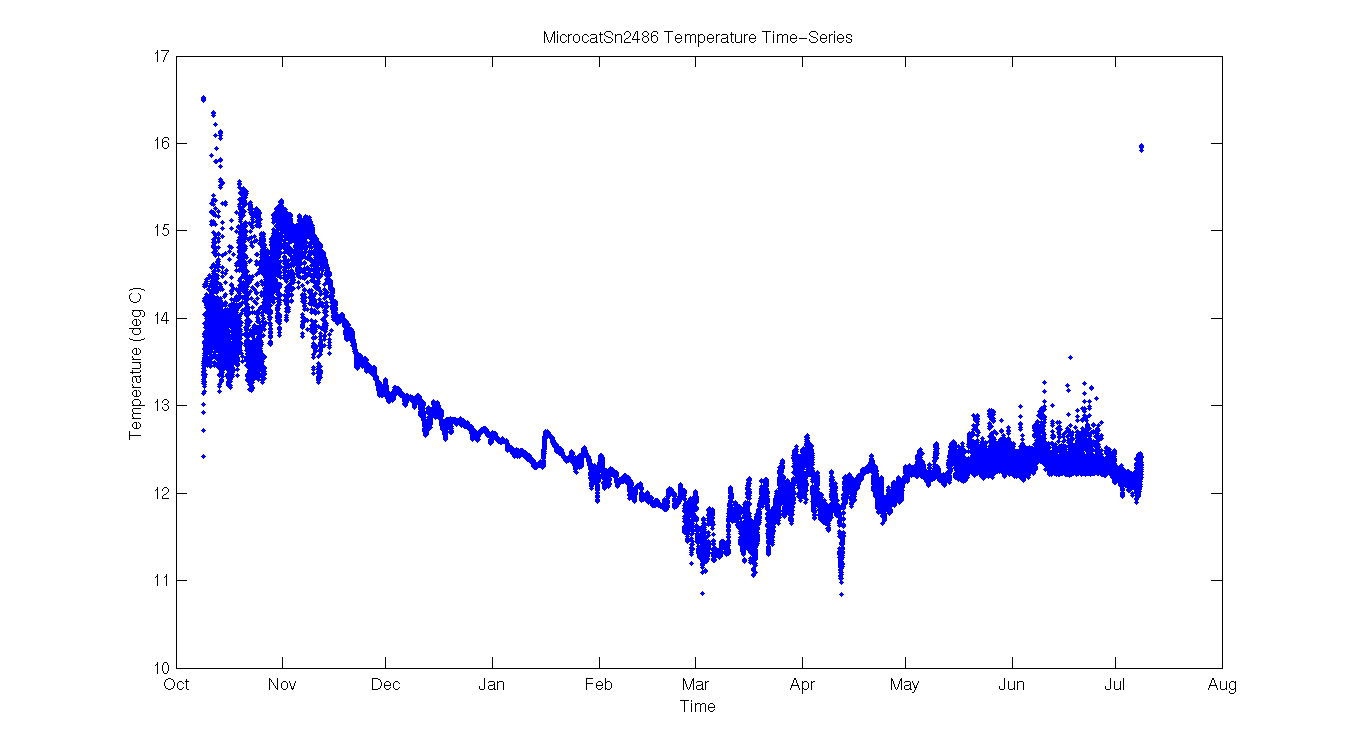
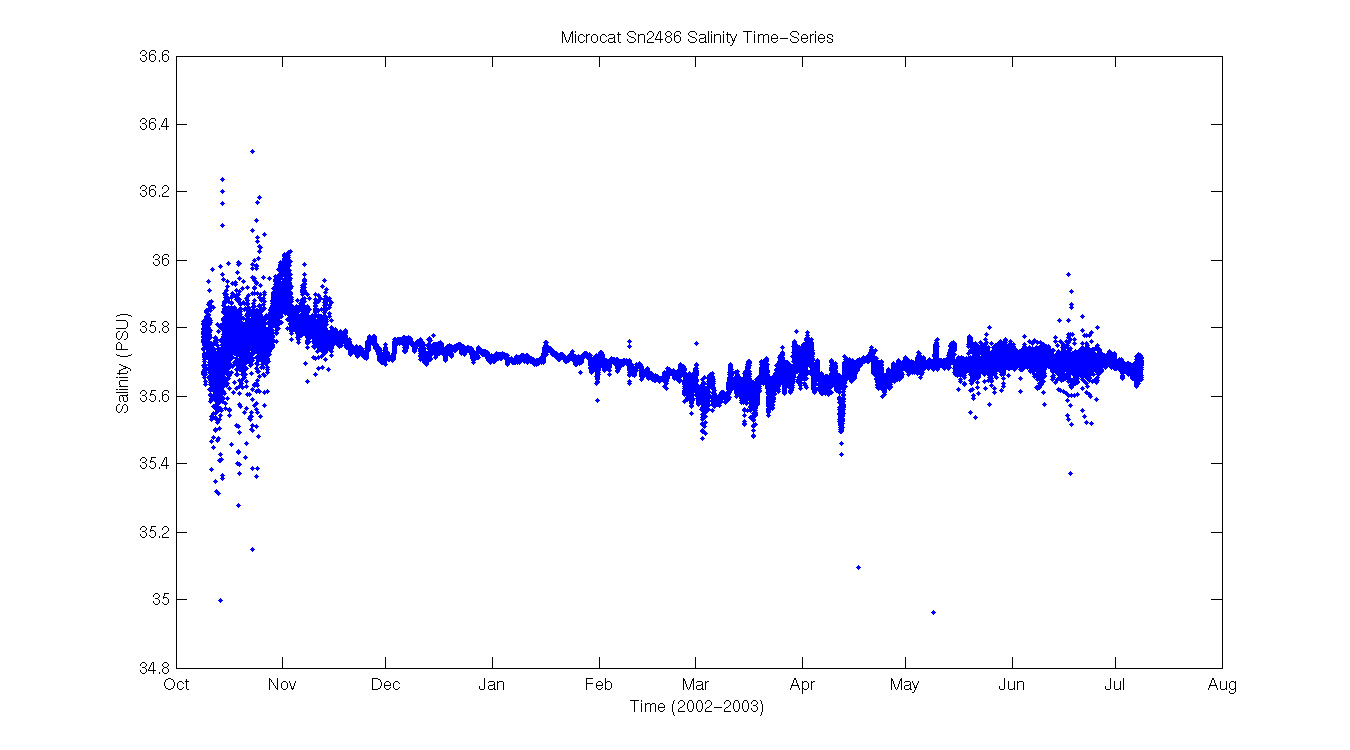
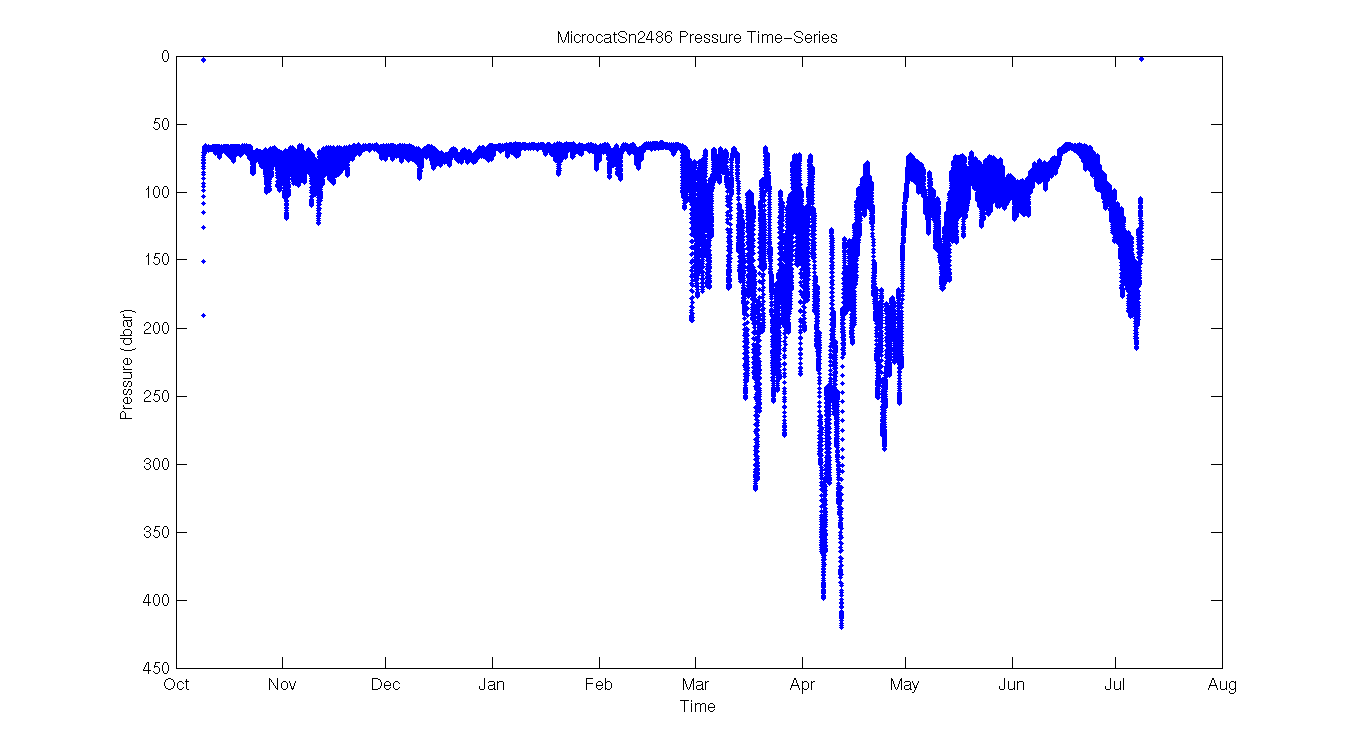
Microcat Sn 2486 Attached to Sensor Frame
Temperature
Salinity
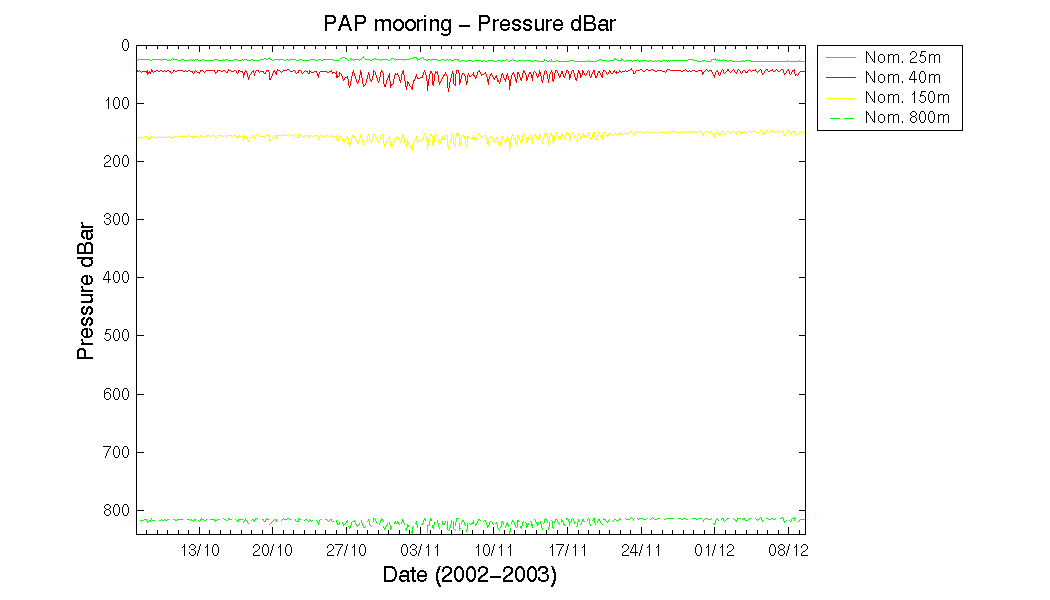
Pressure
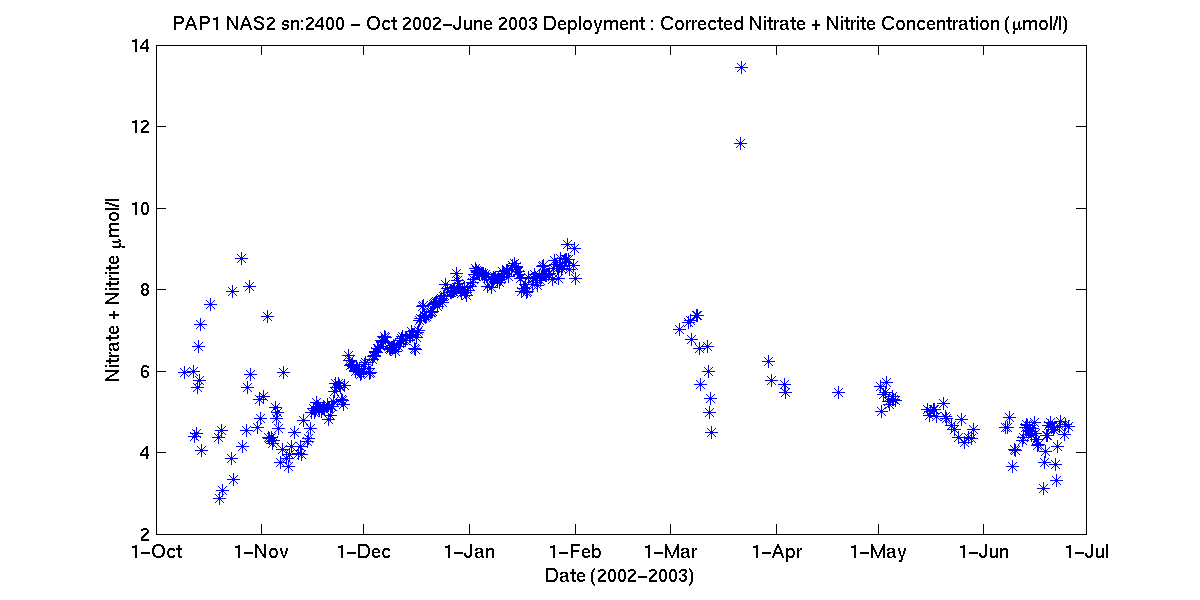
Nitrate (corrected)
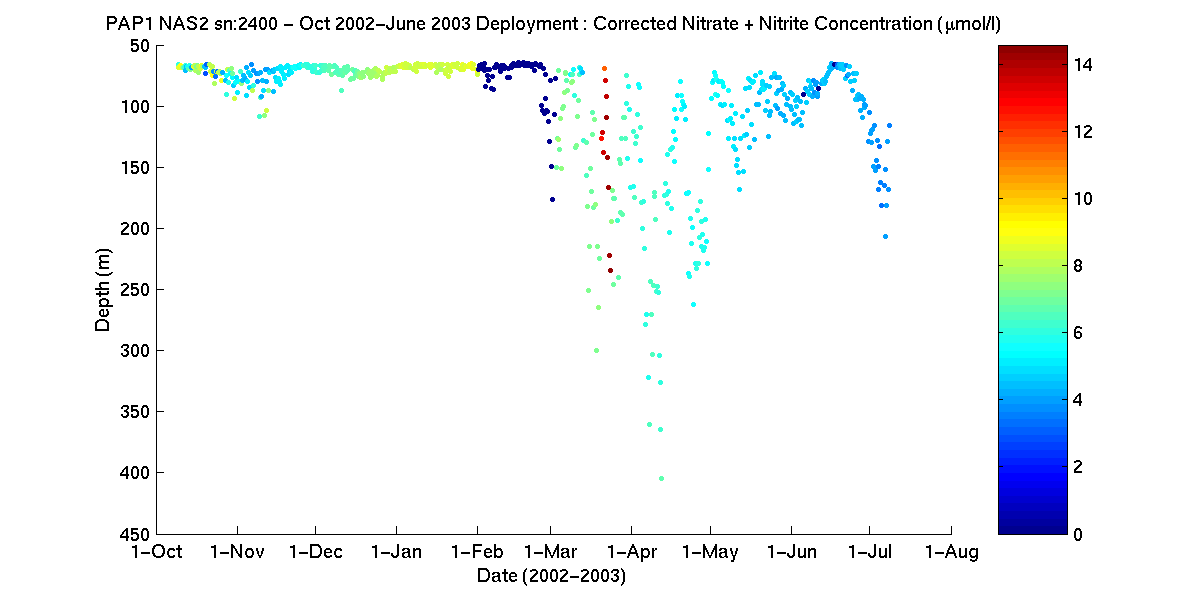
Nitrate (corrected)
Pressure
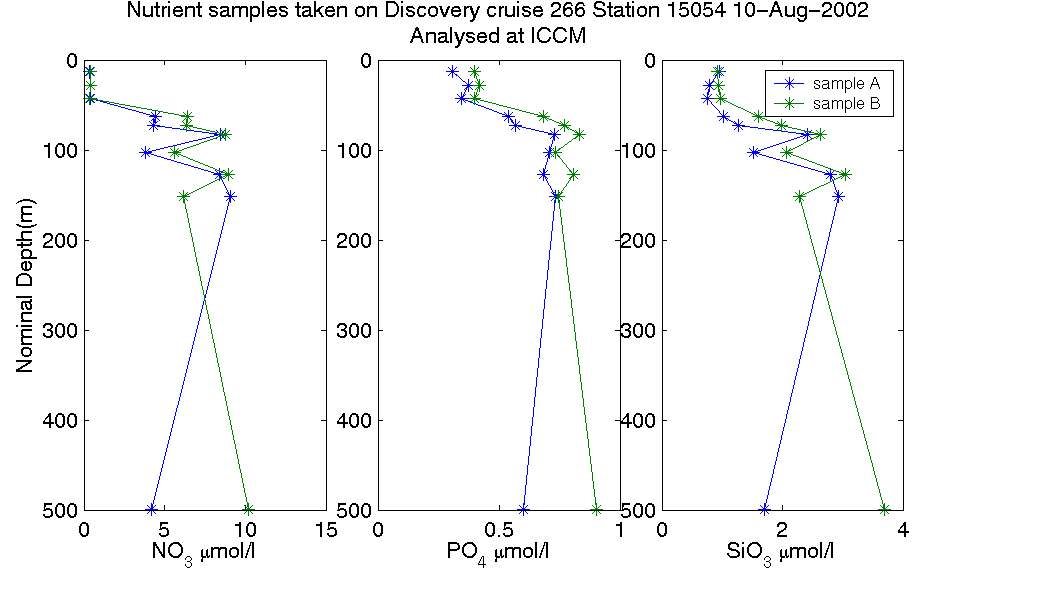
Nutrients
Particle Flux data
Click here to see results from traps recovered during the PAP deployment
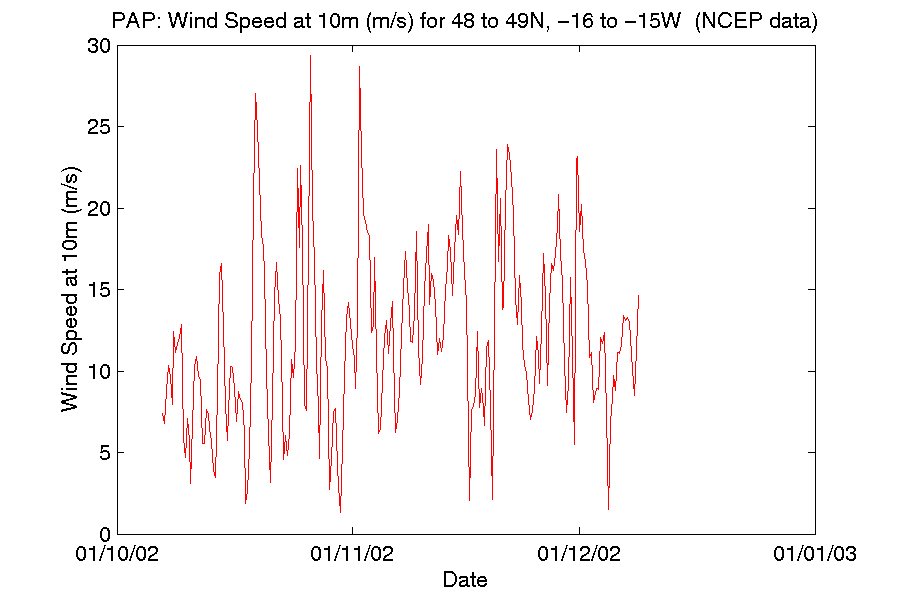
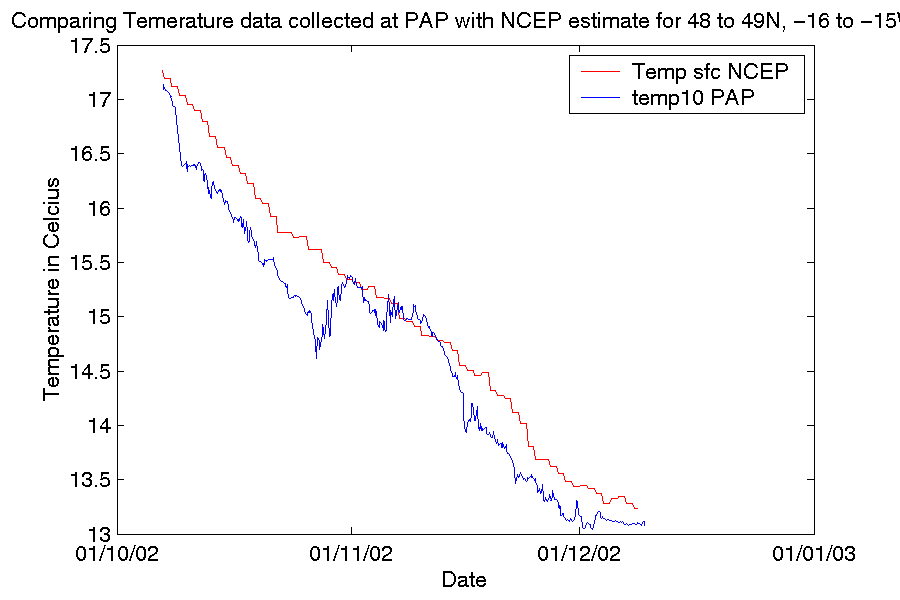
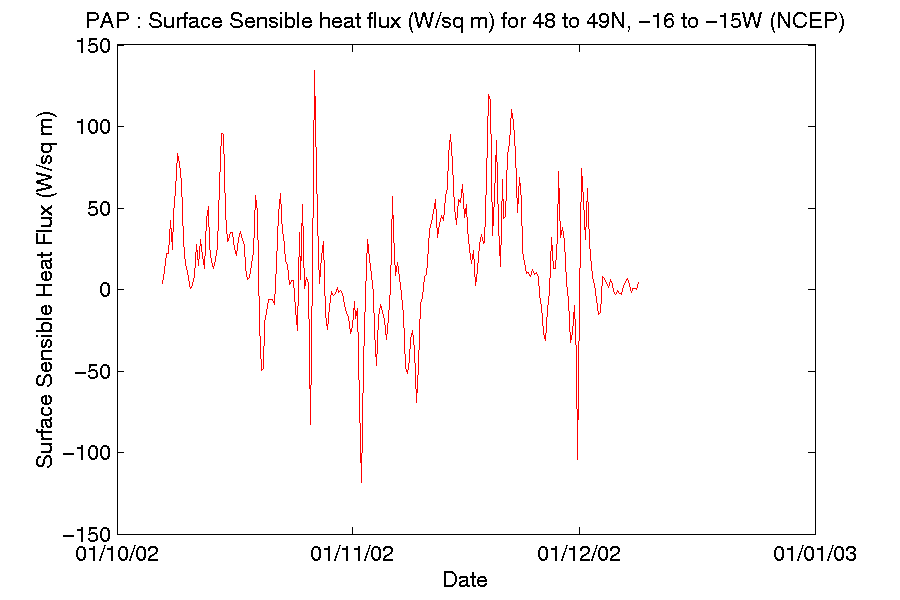
The NCEP/NCAR CDAS/Reanalysis Project makes a large amount of data available on the web, some of which are plotted here
Temperature (NCEP)
Surface Heat Flux (NCEP)
Wind at 10m (NCEP)