The July 2014 deployment was made on RV Meteor cruise M108.
Below are the graphs generated in near-real time from data gathered at PAP and transmitted via iridium servers.
After recovery, data were archived at the British Oceanographic Data Centre (BODC) and can be accessed at: BODC PAP Collection. Please use the search term Porcupine or #5192 to find our data.
March 2015
After a series of storms hitting the PAP site oceanographic data were no longer sent via satellite. The data continued to be logged on the mooring and were recovered in June 2015.
Click here to view engineering graphs
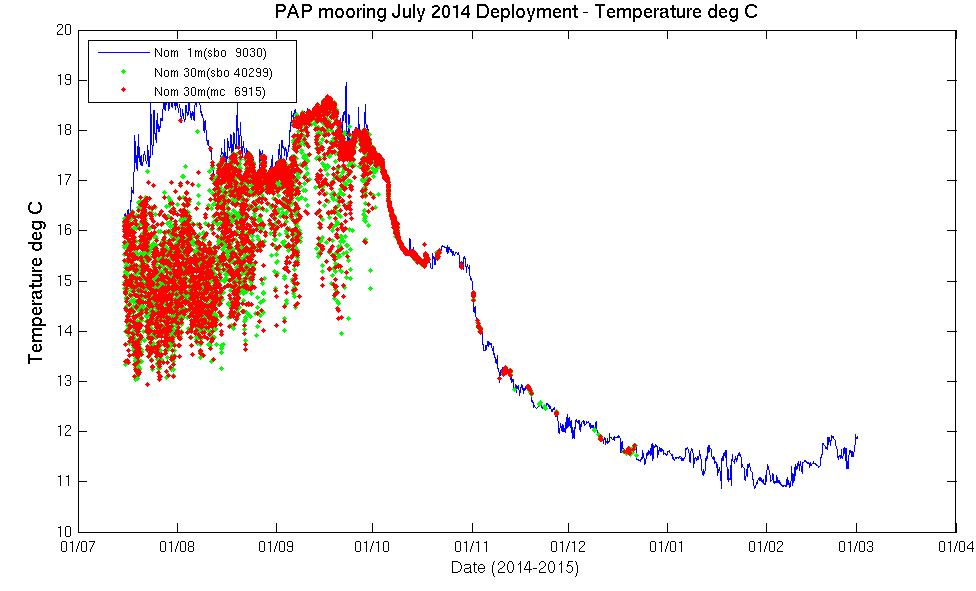
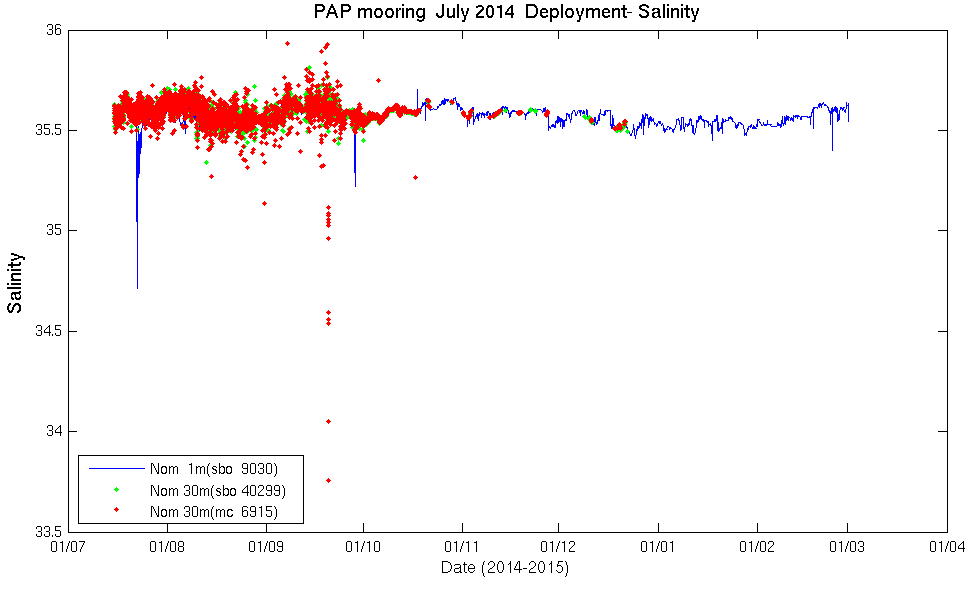
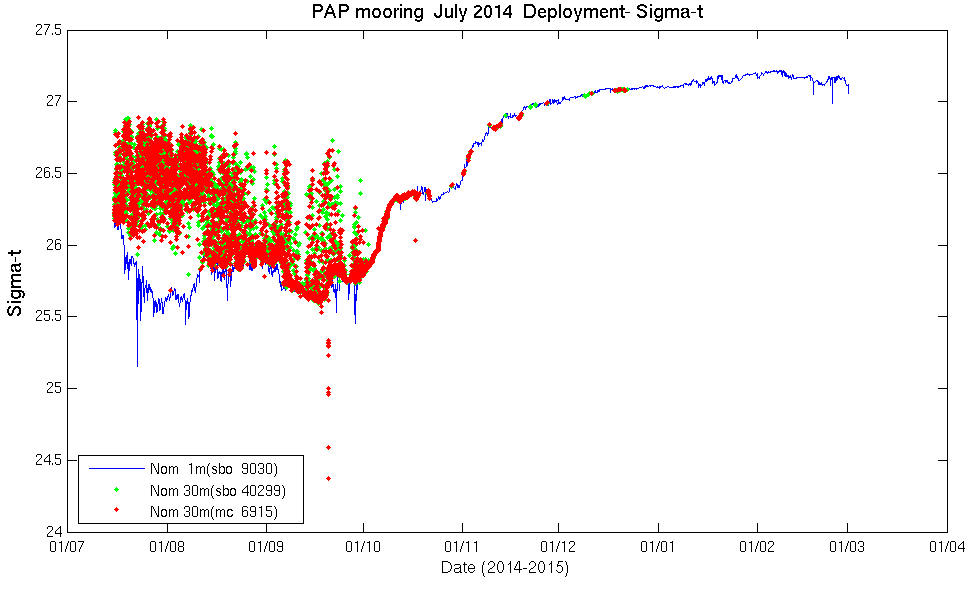
Oceanographic instruments on keel and at 30m on frame, operating in near real time
Temperature
Salinity
Sigma-t
Microcats with Oxygen
Temperature

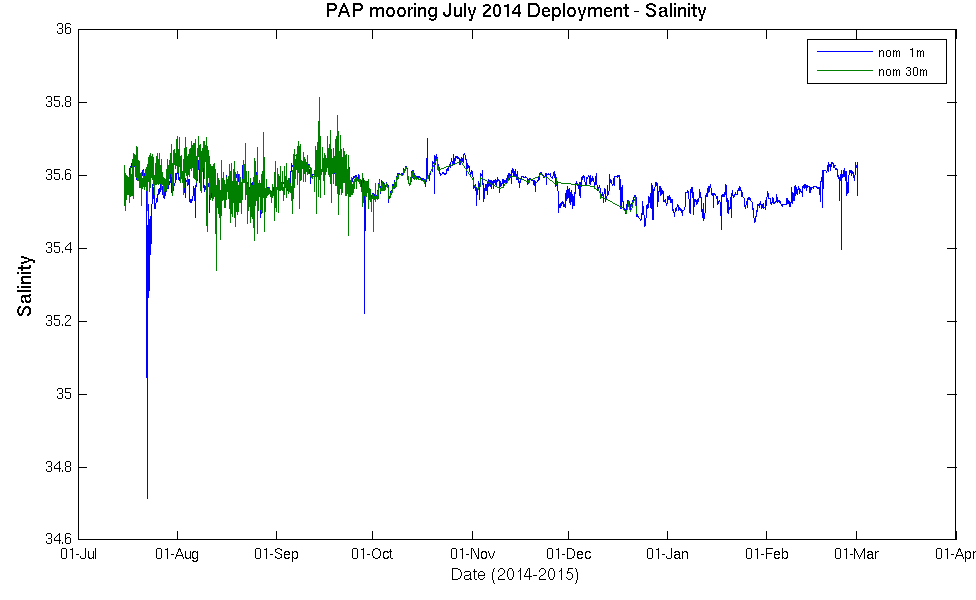
Salinity
Sigma-t

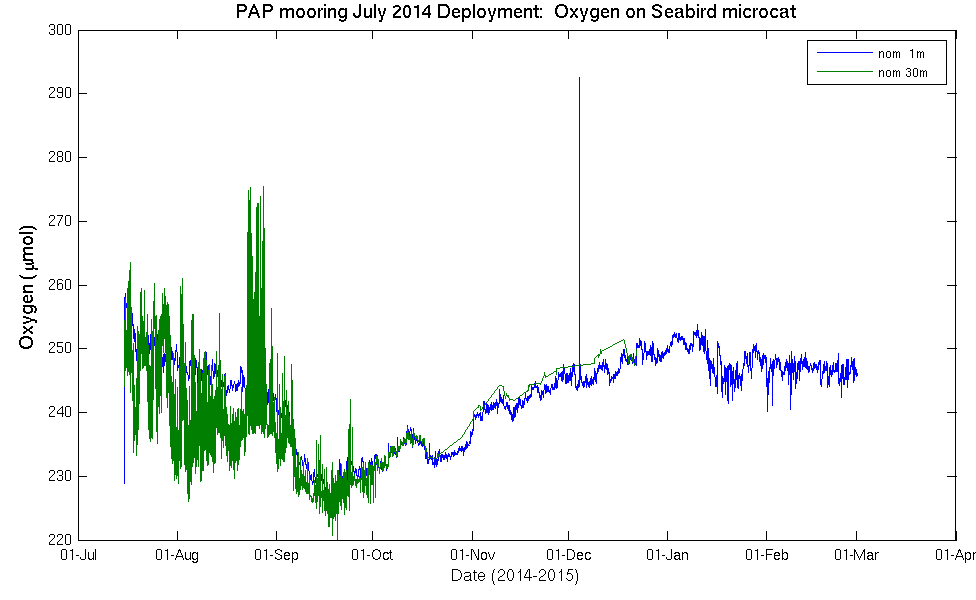
Seabird Oxygen
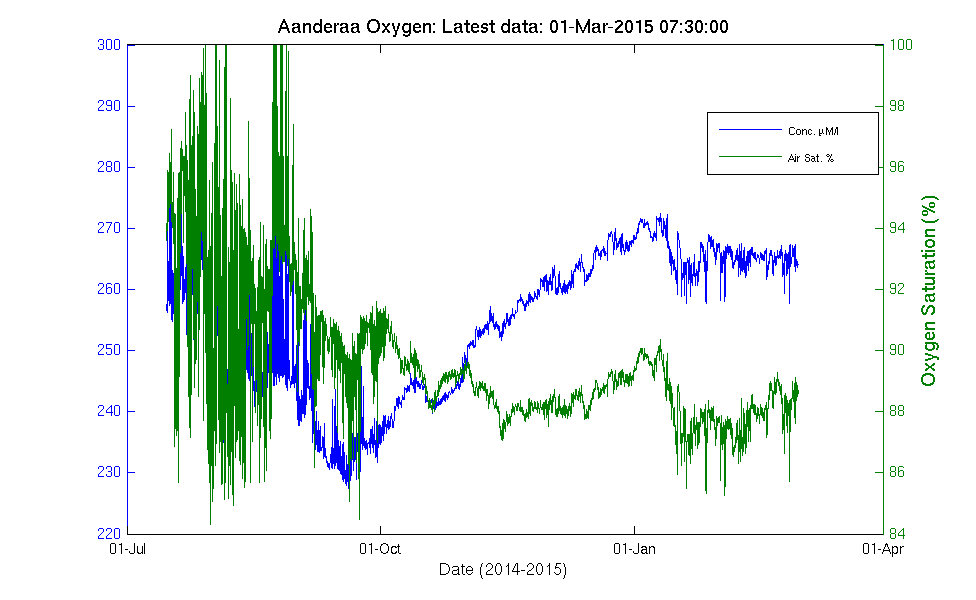
Aanderaa Oxygen
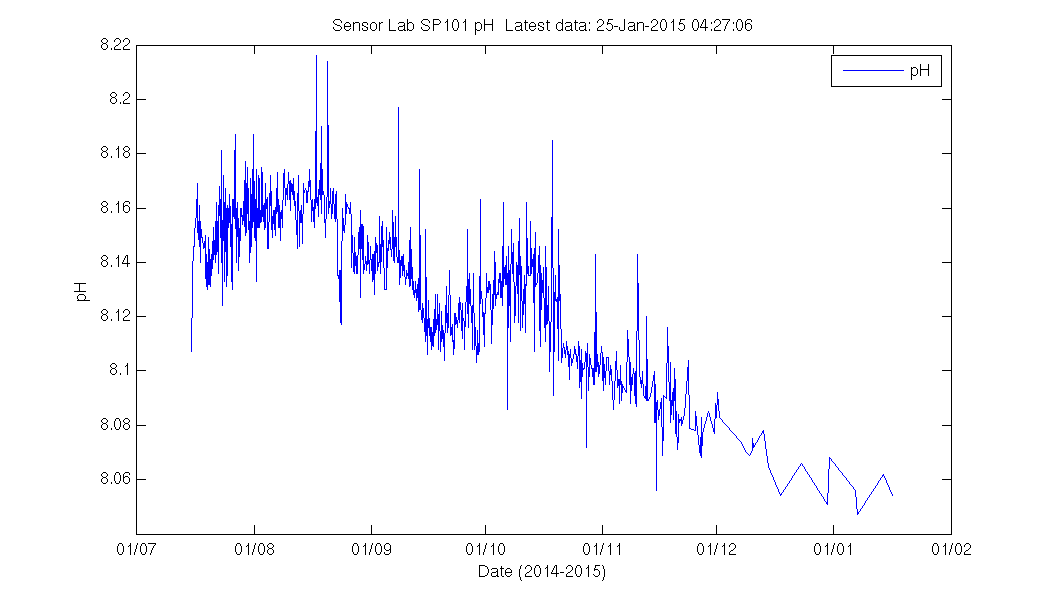
Sensor Lab SP101 pH
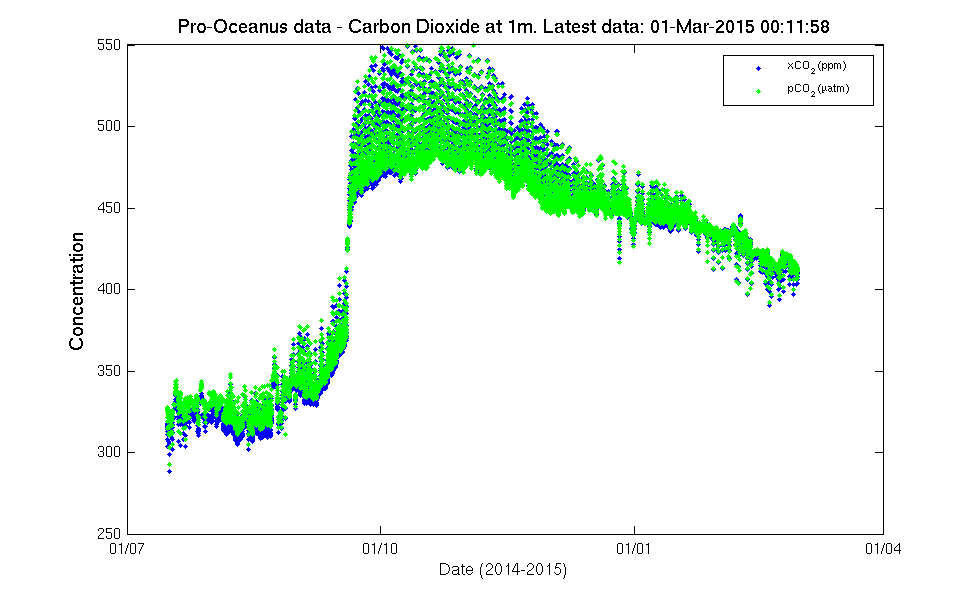
Carbon Dioxide at 1m
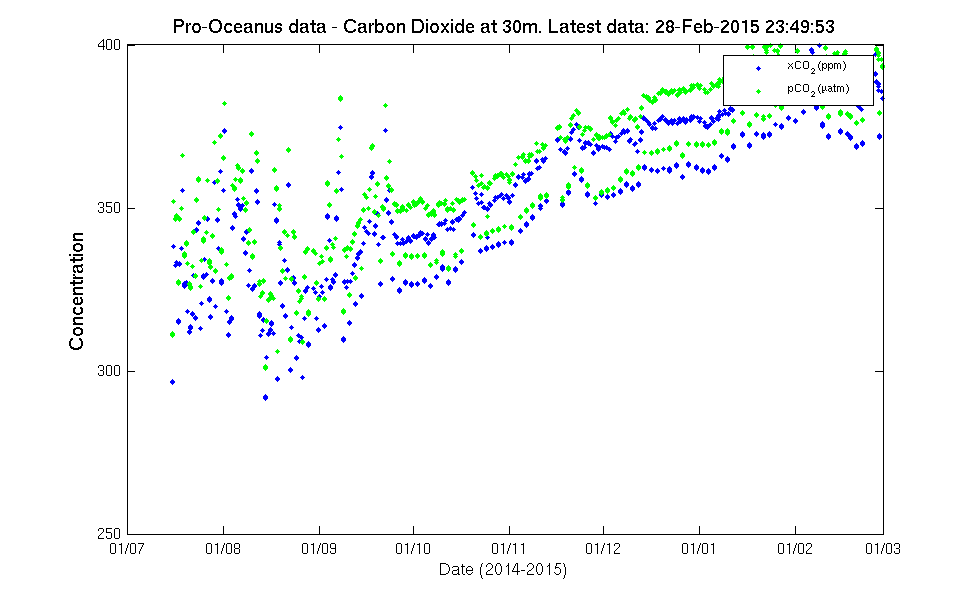
Carbon Dioxide at 30m
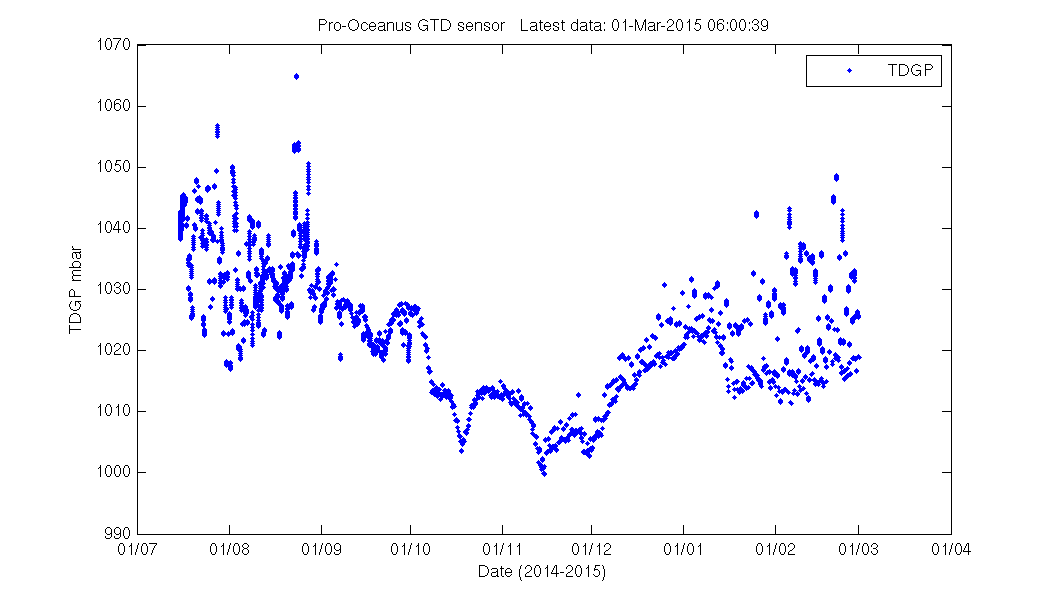
Pro-oceanus GTD-Pro at 30m
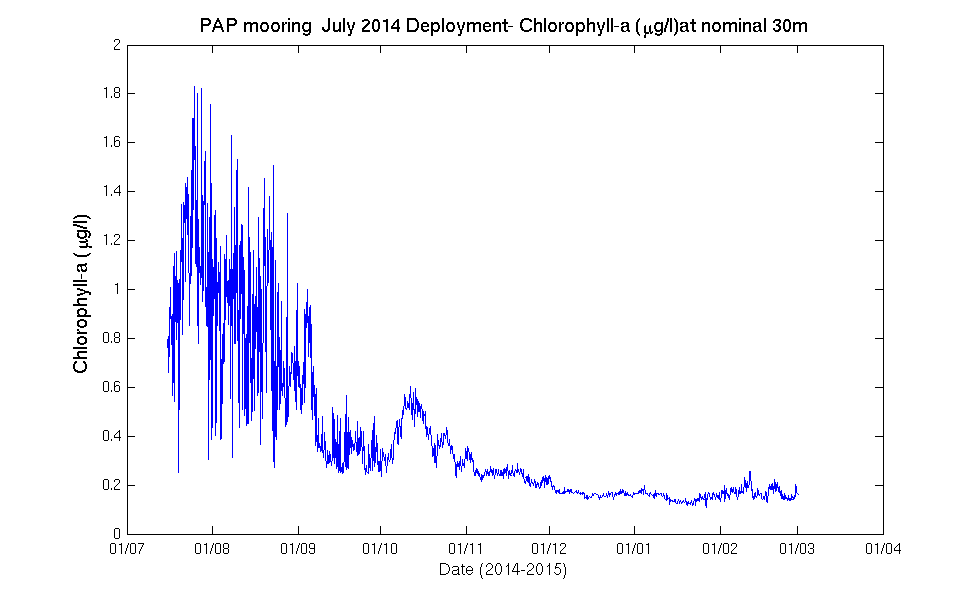
Chlorophyll-a Wetlabs
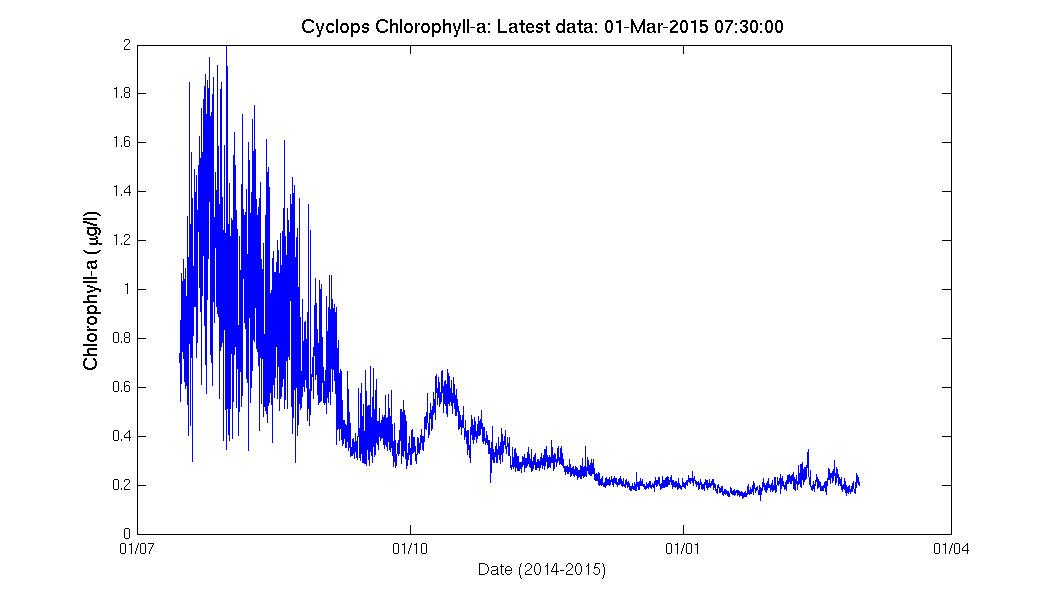
Fluorescence Cyclops
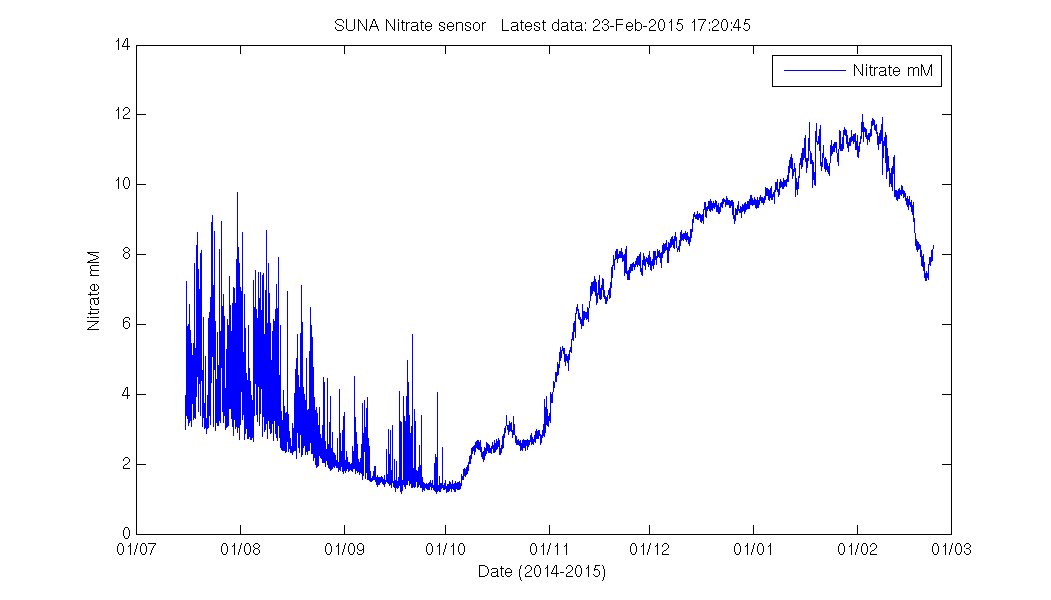
SUNA Nitrate at 30m
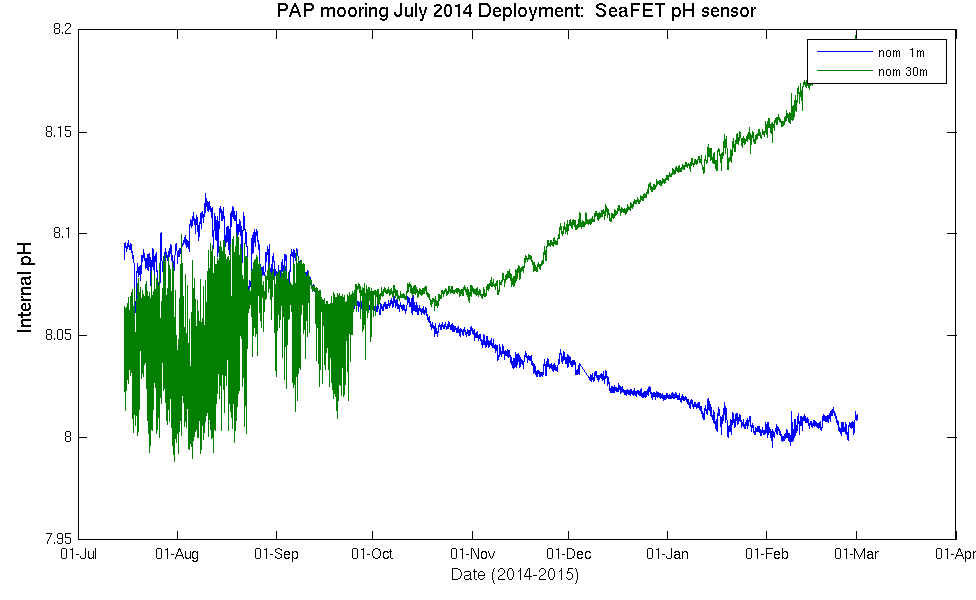
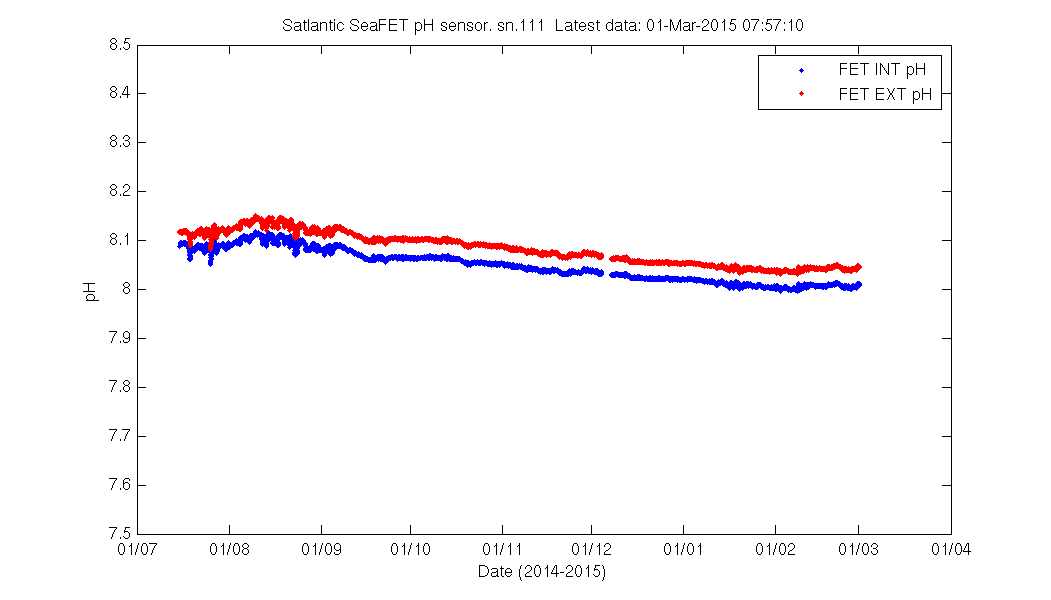
Satlantic pH
Internal
External
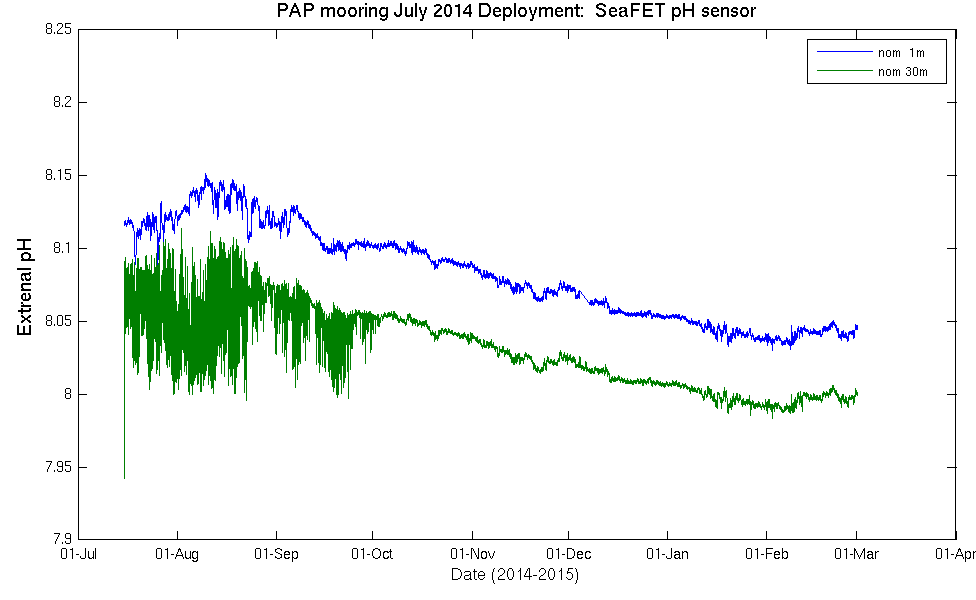
Sensor Sn 111 (at 1m)
Sensor Sn 105 (at 30m)

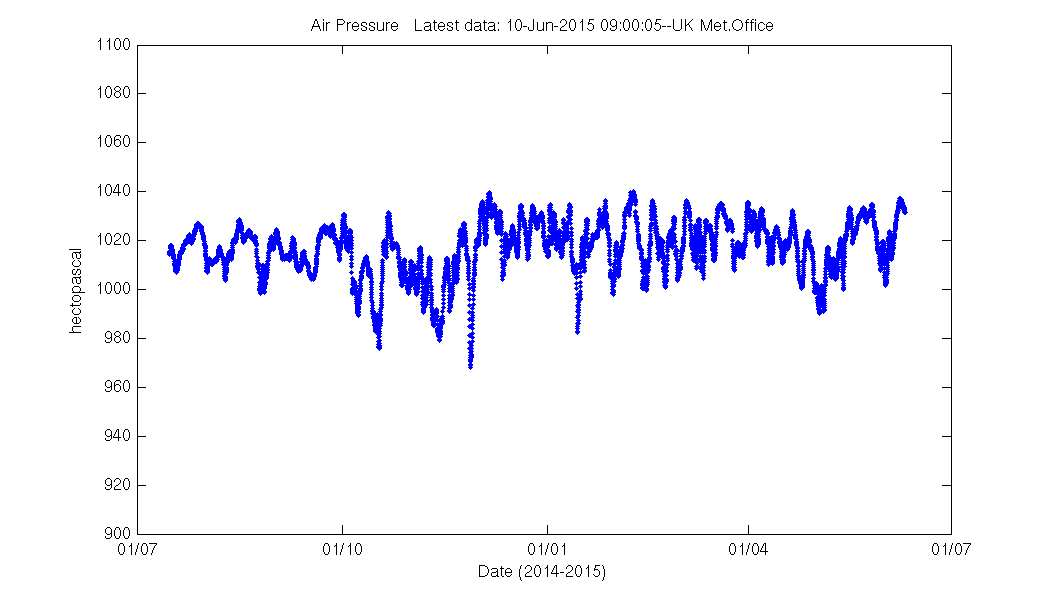
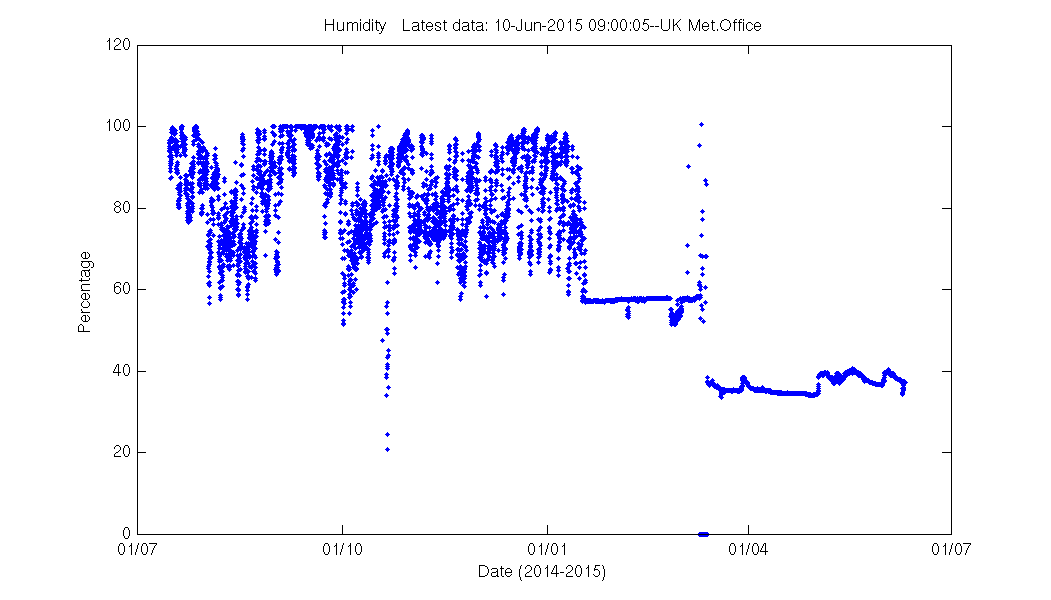
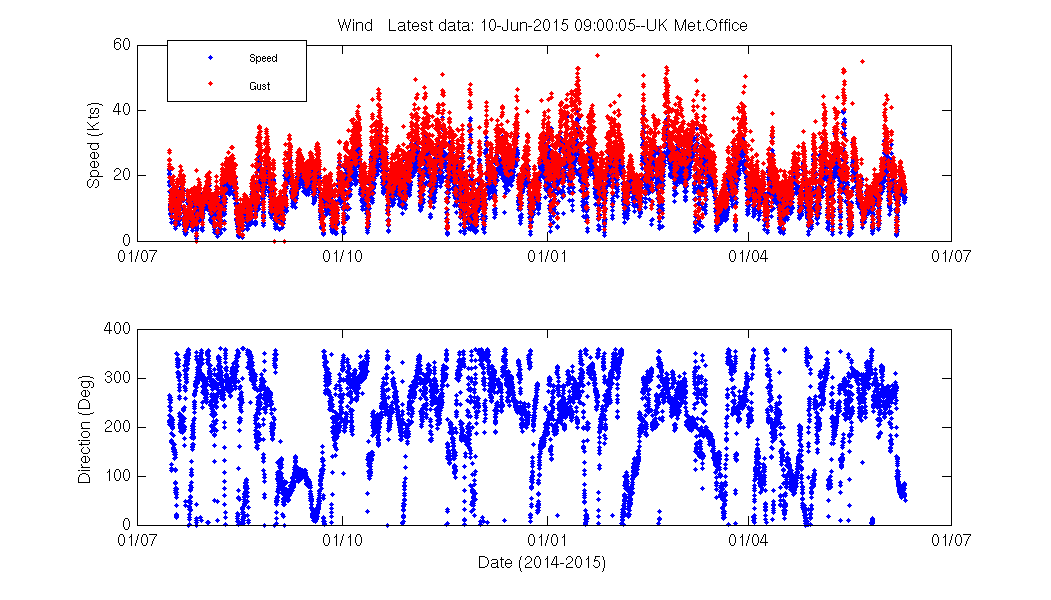
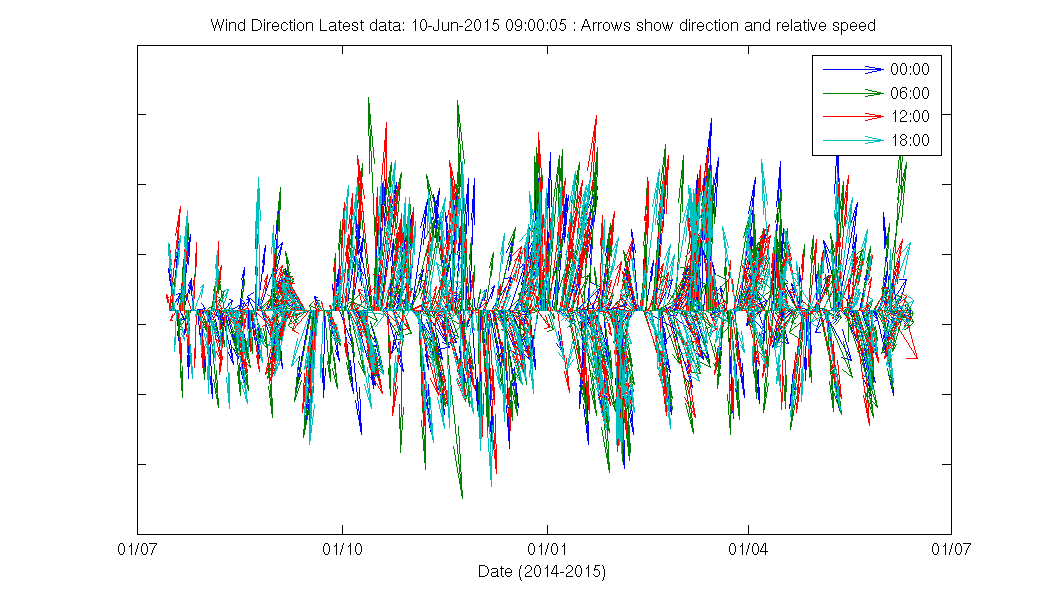
MetOffice UK Meteorological Data
Air Pressure
Humidity
Temperatures

Wind Speed/Direction
Wind Vectors
NCEP Wind
![]()
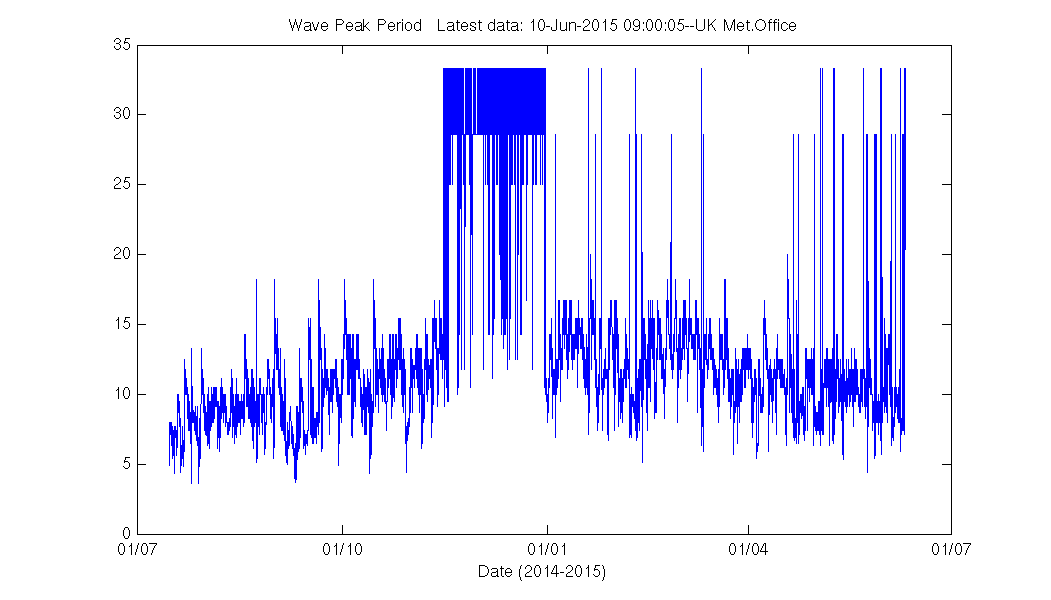
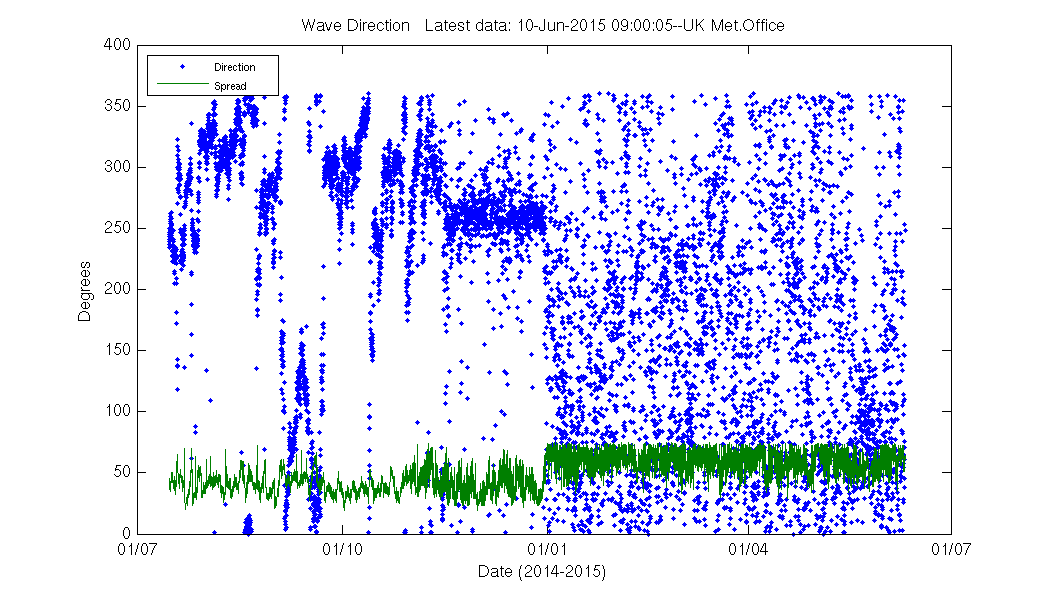
The wave sensor is believed to have started sending spurious readings in September 2014. Data continue to be received and displayed here for completeness.
Wave Height

Wave Peak Period
Wave Vectors
![]()
Wave Direction
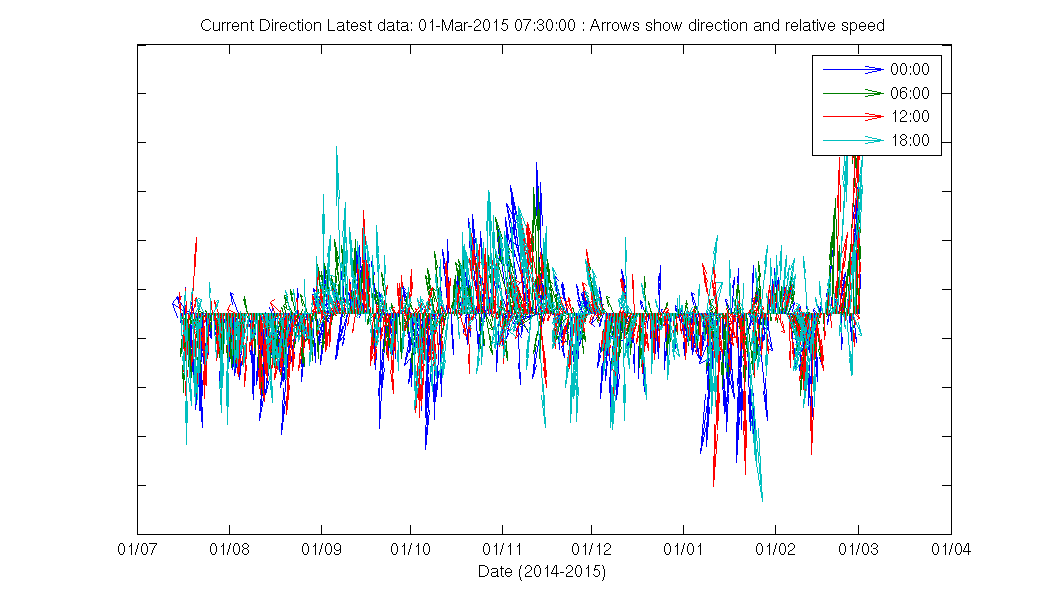
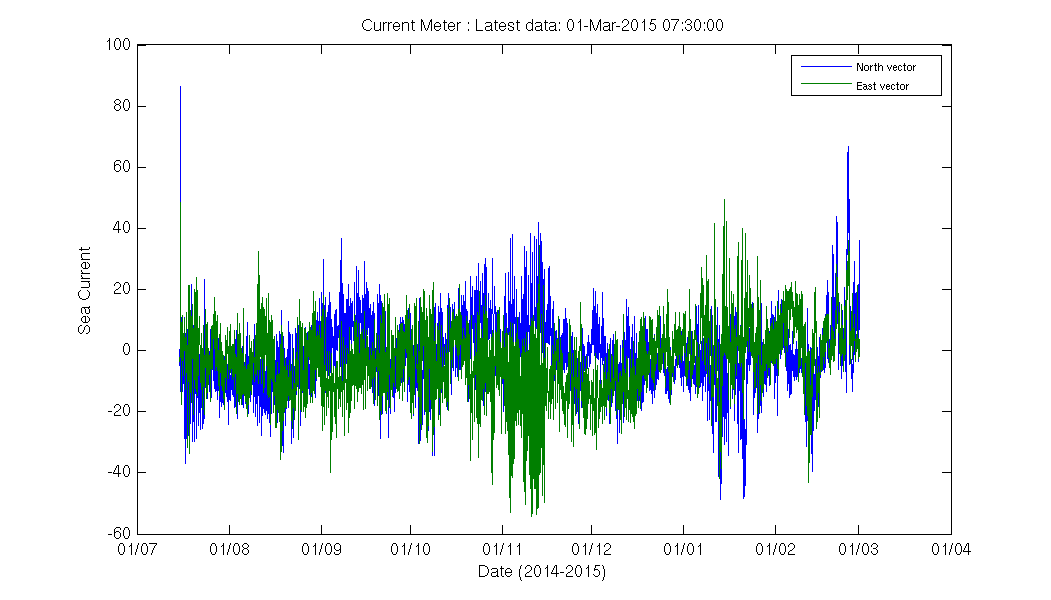
Sea Current Vectors
Sea Current Speed/Direction
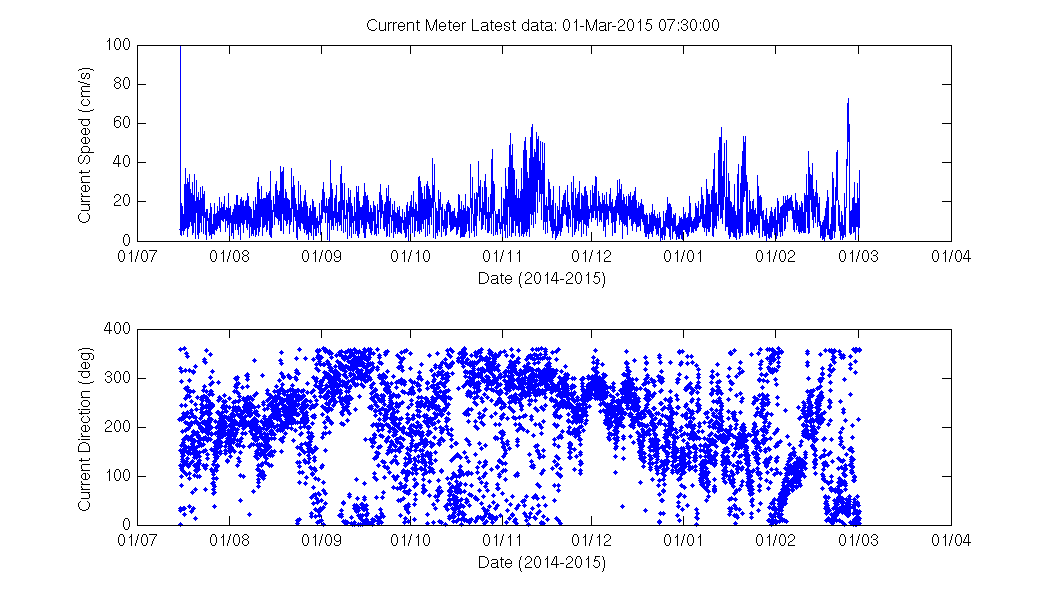
Sea Current
Irradiance 1

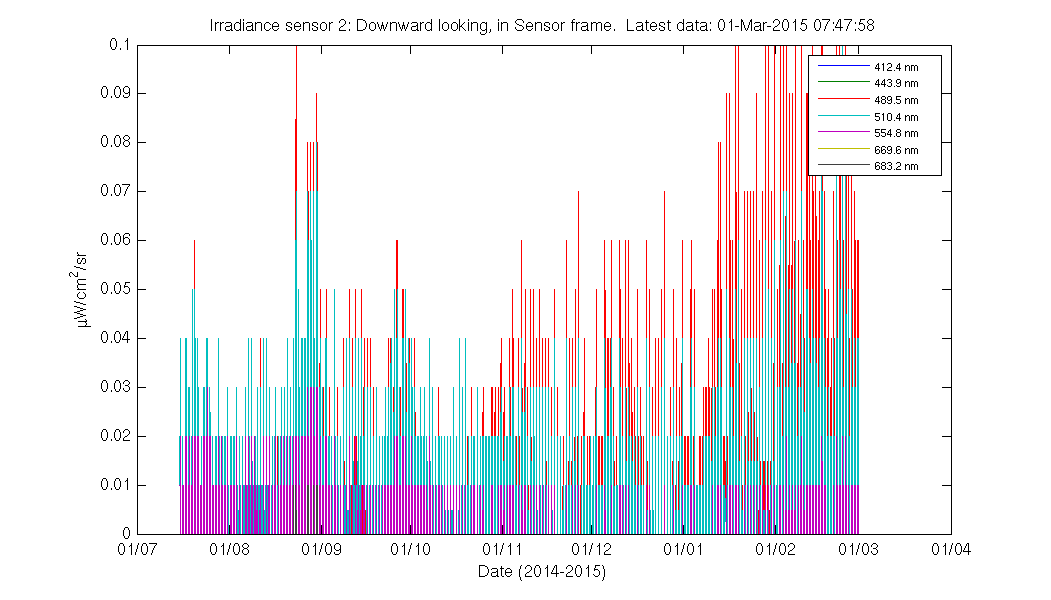
Irradiance 2
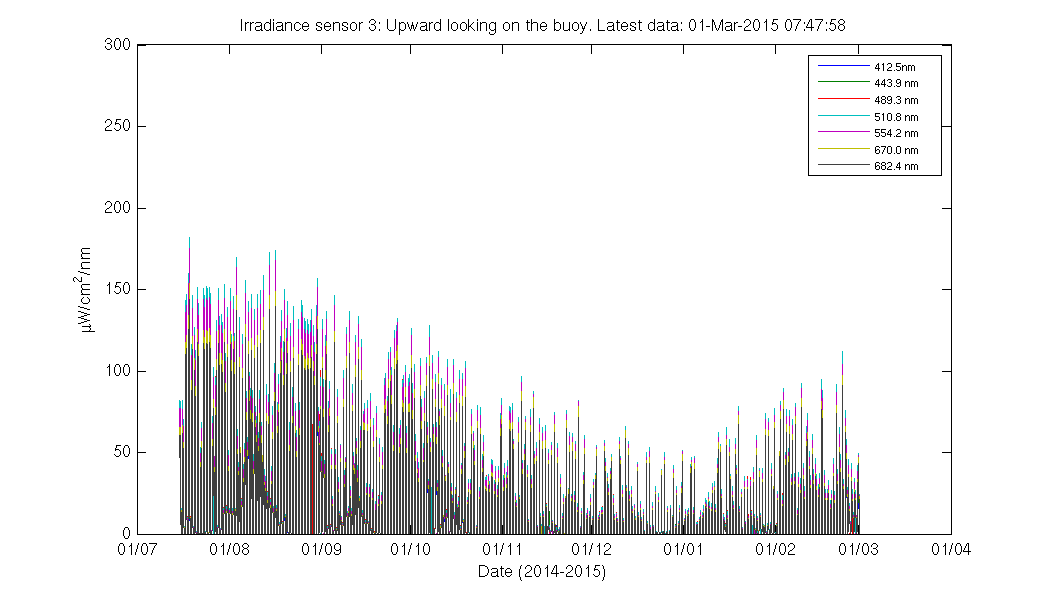
Irradiance 3
Mooring Position
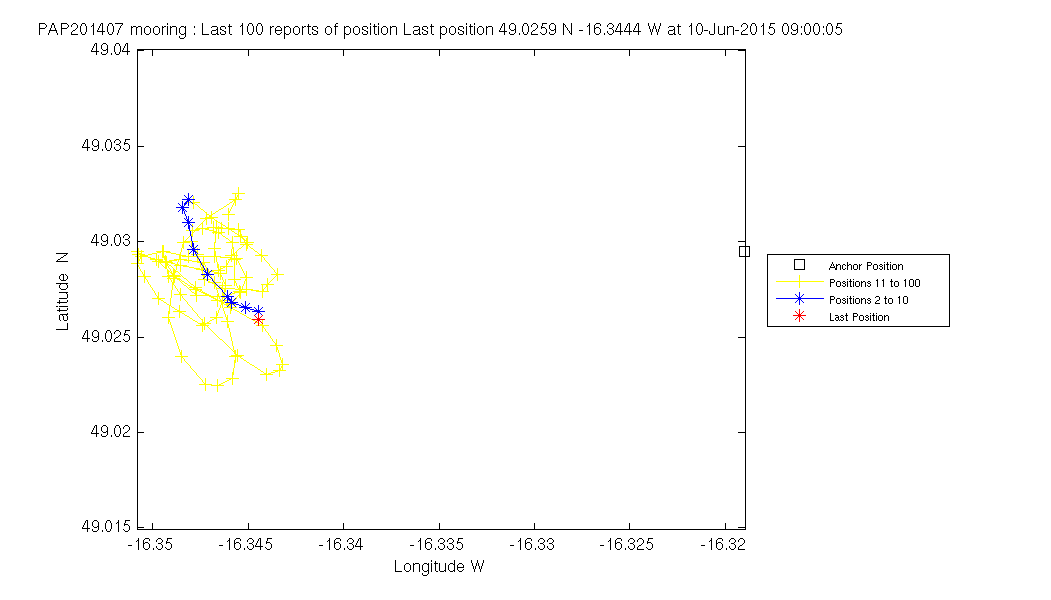
Last 7 days Track

SBO Pressure
